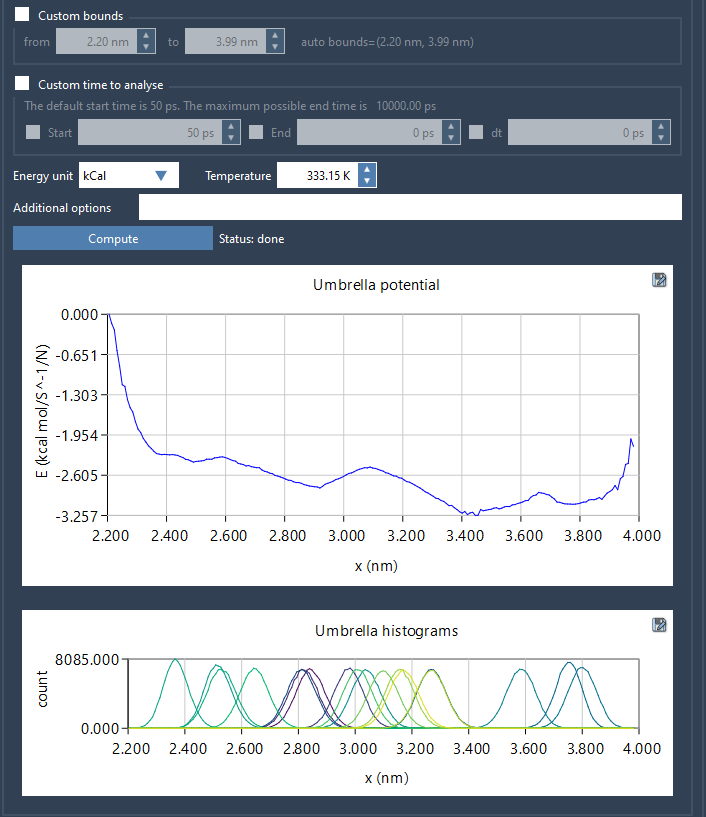
When performing Potential of Mean Force (PMF) calculations, one of the most overlooked yet critical steps is the assessment of histogram coverage. If you’ve ever struggled to understand whether your simulation results are actually telling you the whole story, this one’s for you.
Let’s walk through how the GROMACS Wizard in SAMSON helps visualize and evaluate the reliability of your PMF data using histograms — and why that small graph might actually be your best friend before you draw conclusions from your simulation.
Histogram? Why Should I Care?
In umbrella sampling, simulations are conducted at various positions along a defined reaction coordinate. Each window collects data, and these are assembled using the Weighted Histogram Analysis Method (WHAM) to compute the PMF.
But here’s the key: if parts of the reaction coordinate are under-sampled — meaning the histogram is sparse or irregular — then the resulting PMF curve can be misleading. It might look smooth, but it’s based on incomplete data.
How GROMACS Wizard Helps
Once your simulations are complete and you proceed to the WHAM Analysis tab in GROMACS Wizard, you’ll be prompted to select your project folder. If you used umbrella sampling steps earlier, you can even auto-fill the path using this button:
![]()
The software then scans the folder structure — ideally a series of numbered subfolders containing simulation results — and loads key data like reaction coordinates, time, and temperature. Once you’ve selected a reaction coordinate and hit Compute, the wizard displays:
- The PMF plot — the central result you’re probably interested in
- The histogram — a diagnostic tool that tells you how well each section of the coordinate space is covered

Reading the Histogram: A Quick Guide
Here’s how to interpret the histogram graph to maximum effect:
- Flat or uniform distribution: Good coverage — your sampling is likely reliable.
- Spikes or missing regions: Indicates areas where your simulation lacks sufficient data. You may need to re-run or extend simulations in those windows.
The histogram lets you make informed decisions: is more sampling required? Are some regions unconstrained?
Why This Matters
Investing time upfront to inspect these histograms can save hours of computational work later. Instead of blindly trusting the PMF curve, you can see precisely where your data supports the curve — and where it doesn’t.
And because GROMACS Wizard automatically saves the histogram and PMF under the wham_results subfolder, you can easily revisit and compare analyses when changing parameters or reaction coordinates. No redundancy. No confusion.
If you work in molecular modeling or drug discovery and need accurate PMFs, consider making histogram inspection a regular part of your workflow. It’s a small detail that brings valuable clarity.
Learn more by reading the full GROMACS Wizard documentation page.
SAMSON and all SAMSON Extensions are free for non-commercial use. You can download SAMSON here.


