One common challenge molecular modelers face when performing umbrella sampling simulations is the post-processing step: extracting the Potential of Mean Force (PMF) from a set of umbrella windows. Setting up the right environment, finding coordinated inputs from multiple simulations, and applying a consistent analysis method like WHAM can be tedious and error-prone.
The GROMACS Wizard in SAMSON offers a streamlined approach to this by integrating WHAM analysis directly into a graphical environment. This blog post explores how it helps you go from simulation data to PMF plots with minimal manual effort, especially when your umbrella sampling simulations are generated via SAMSON’s batch system.
What problem does this solve?
After running dozens—or even hundreds—of umbrella windows, researchers often have to manually collect the outputs, ensure proper formatting, define consistent reaction coordinates, and execute WHAM calculations from the command line. Mistakes in folder structure or inconsistent settings can lead to misleading results, requiring frustrating re-runs. This step is often a bottleneck that complicates the otherwise automated workflow.
How does GROMACS Wizard simplify PMF analysis?
In the GROMACS Wizard’s WHAM Analysis tab, you can select the folder containing your simulation results. If your project is a continuation of an Umbrella Sampling simulation, the tool even includes an auto-fill button (![]() ) to automatically identify the relevant project location.
) to automatically identify the relevant project location.
Projects are expected to contain multiple subfolders named with increasing numbers (e.g., 0, 1, 2…), each representing one umbrella simulation window. The wizard reads metadata such as reaction coordinate names, bounds, run time, and temperature directly from the simulation files. This removes the need to set up WHAM manually, reducing errors due to improper input formatting.

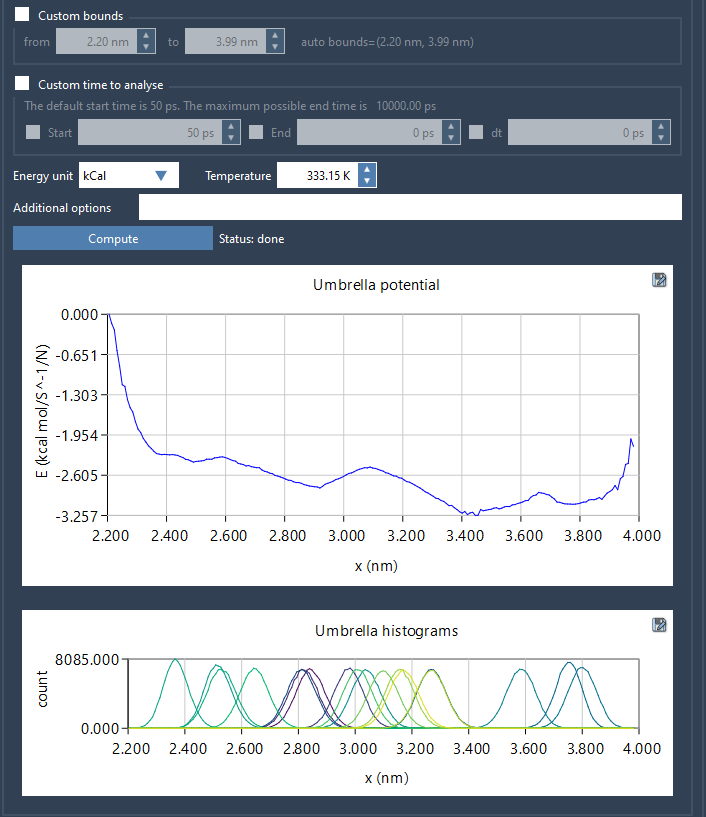
Once you load the directory, select the reaction coordinate you wish to analyze. You can customize parameters like time intervals, energy units, and boundaries. Clicking Compute starts the WHAM calculation. Depending on trajectory length and system size, the process may take a few seconds to minutes.

Outputs that provide insight
After the computation, GROMACS Wizard displays both the PMF and a histogram plot. The PMF graph shows the free energy profile along the chosen reaction coordinate. The histogram helps you identify regions where sampling was sparse—highlighting areas where additional computation might improve accuracy.
All results, including plots and data, are saved in a dedicated wham_results subfolder. If you switch between reaction coordinates, the wizard recognizes previously computed results and avoids reprocessing the same data, saving time when performing comparative analyses.
Reducing slowdown in your workflow
This integrated WHAM analysis helps researchers focus more on interpretation and less on data wrangling. That’s especially useful in high-throughput simulations for biomolecular systems and drug discovery studies, where time to insight matters.
To learn more and see the complete tutorial, visit the original documentation page: GROMACS Wizard – PMF Analysis.
SAMSON and all SAMSON Extensions are free for non-commercial use. You can get SAMSON at https://www.samson-connect.net.


