


Refining protein structures can be inefficient when outlier residues fall outside allowed conformations in a Ramachandran plot. If you’ve ever opened a homology model or experimental structure only to see white dots far from the safe yellow zones, you know the struggle. These outliers can disrupt downstream simulations or reduce confidence in active-site geometry.
What if you could tackle this visually and interactively, rather than dig through atomic coordinates or adjust rotamers one command at a time? SAMSON’s Interactive Ramachandran Plot extension offers just that—a way to explore and edit backbone conformations graphically, with direct feedback on molecular structure. Here’s how it can help refine your models more effectively.
How It Works
After adding the Interactive Ramachandran Plot extension in SAMSON, open your protein of interest—this example uses PDB ID 1YRF—and load it through the Home > Fetch menu.
Once your structure is loaded, open the Ramachandran Plot App via Home > Apps > Biology > Ramachandran plot. You’ll see a familiar φ (phi) vs. ψ (psi) angle diagram, color-coded for conformational favorability:
- Yellow — Energetically allowed regions
- White — Disallowed conformations
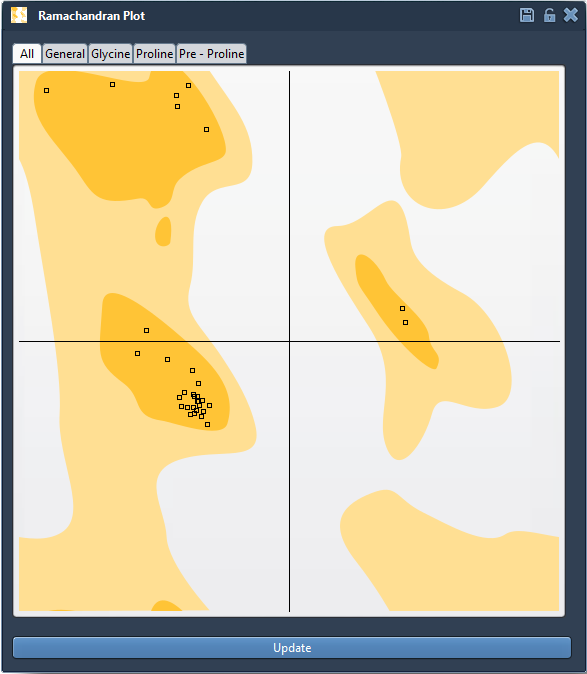
Interacting with the Plot
What sets this tool apart is interactivity. By clicking on individual residues (dots in the plot), you can:
- Select the corresponding residue in the 3D viewport
- Read its φ and ψ angles
- Identify residue types (General, Glycine, Proline, Pre-proline)
In this example, clicking on a Proline residue highlights it both on the plot and in the molecular structure window:
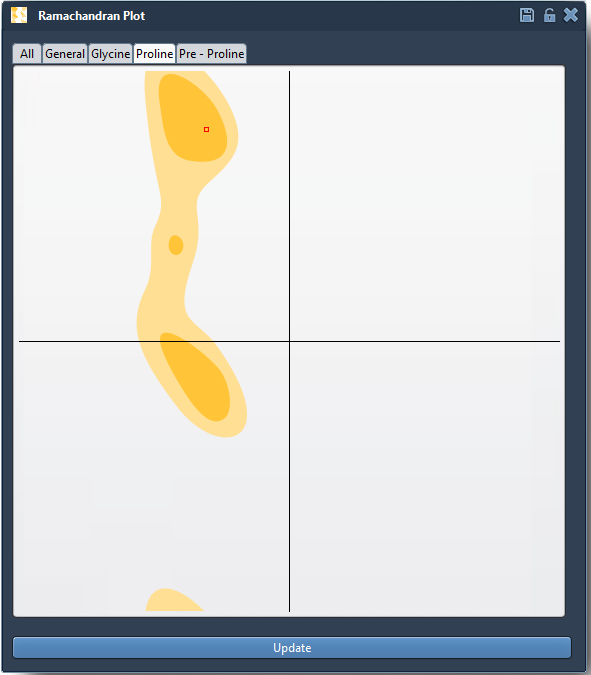
The status bar updates φ and ψ angles instantly:

Two Ways to Edit
Option 1: Drag Directly on the Plot
Simply drag a dot to move a residue into an allowed region. The 3D structure updates immediately to reflect the change, offering live feedback on torsion adjustments. An undo shortcut (Ctrl/Cmd + Z) lets you revert quickly.
Option 2: Use the Twister Editor
For more spatial control, activate the Twister editor from the sidebar, and rotate dihedral angles directly within the 3D model. You’ll see the Ramachandran plot update live, ensuring informed editing:
Why It Matters
Outliers often arise from homology modeling artifacts, crystal packing, or poor loop definition. Interactive editing helps resolve these quickly, without diving into text-based coordinate editing or scripting. Instead, you bring problematic residues into allowed zones visually, improving model quality and simulation readiness in just a few steps.
Learn More
To explore all features of the Ramachandran Plot extension — including integration with normal mode analysis — please visit the full documentation page: Interactive Ramachandran Plot – SAMSON Documentation.
SAMSON and all SAMSON Extensions are free for non-commercial use. You can download SAMSON at https://www.samson-connect.net.