Monitoring how ligands move through complex molecular structures is a common yet challenging task in computational chemistry and structural biology. Whether you’re analyzing unbinding events, comparing pathways, or preparing visual reports, the ability to track the motion of a molecule can provide valuable insights. But setting this up in a 3D visualization environment often requires a mix of scripting, data manipulation, and visual modeling—which can be time-consuming and opaque.
If you’re using SAMSON, however, there’s a way to get clear visual feedback on how a ligand moves through space, using the Pathlines extension. With this visual model, you can track the center-of-mass displacement of a ligand or any group of atoms along predefined paths—without coding anything.
What Problem Does This Solve?
Imagine you’ve simulated a ligand unbinding event using a reaction coordinate or path-sampling method. You want to now see how it moved, and maybe share that with collaborators. You could export coordinates, compute distances manually, or script animations—but that’s a lot of overhead.
The Pathlines extension offers an easier way to:
- Display the route a ligand takes over time using a curved path representing its center of mass
- Compare several paths (e.g. from various unbinding trials) visually
- Quickly explore how a molecule progressed along a reaction tunnel
How It Works
Once you’ve opened a molecular document in SAMSON with one or more paths (from tools like Ligand Path Finder), creating a pathline is straightforward.
- Select the ligand or group of atoms you’re interested in from the Document view.
- Optionally, also select one or more paths to visualize. If you skip this, the extension uses all paths in the document.

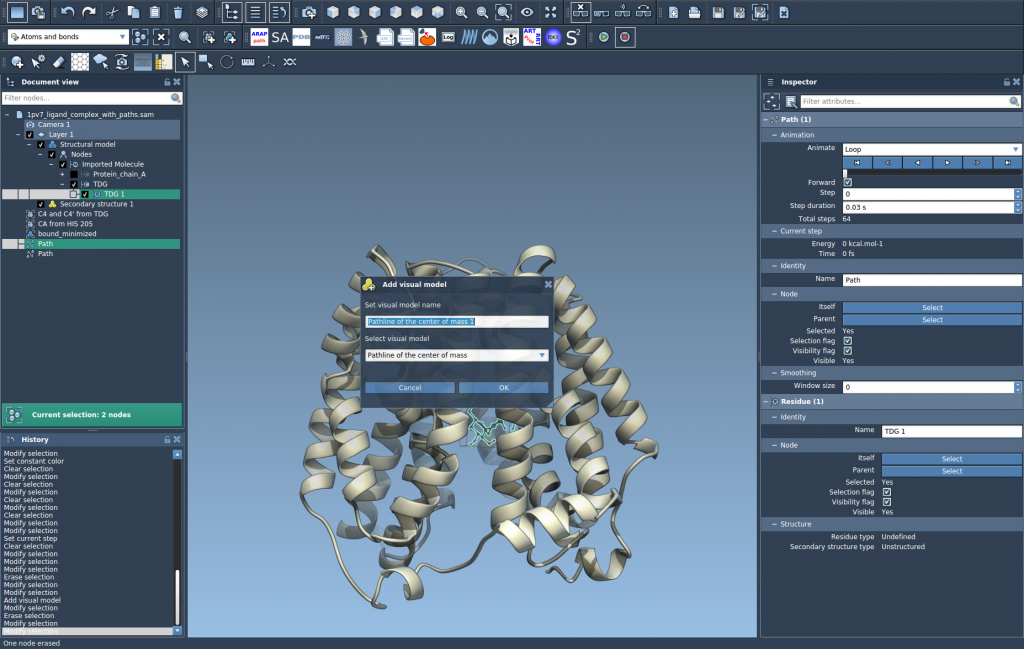
- Go to Visualization > Visual model > More… (shortcut: Ctrl/Cmd + Shift + V), then choose Pathline of the center of mass.

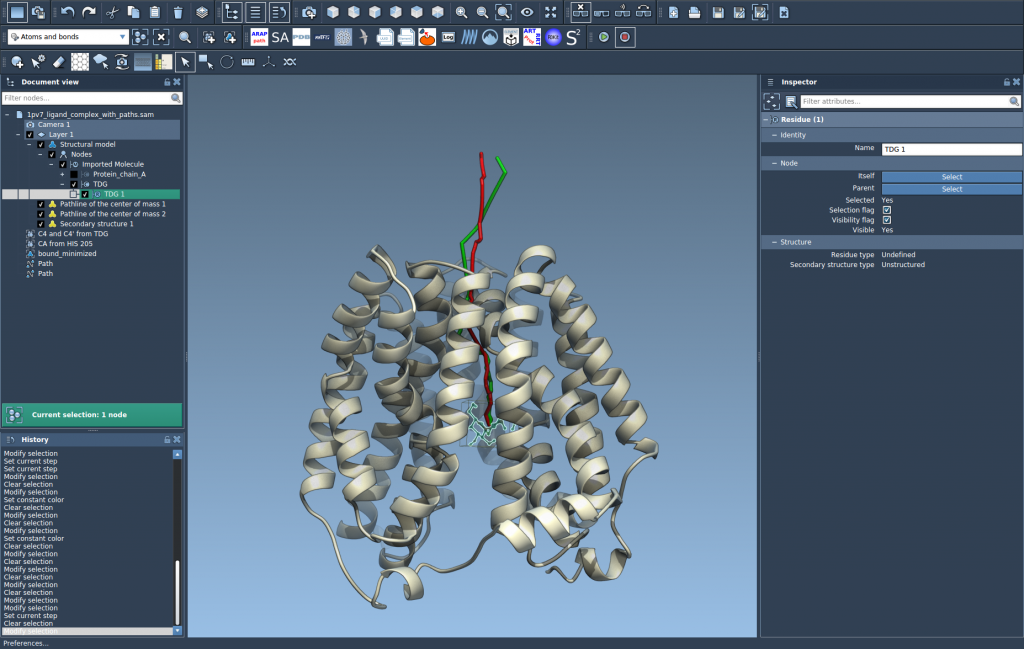
This will create a colored path showing how the selected group’s center of mass travels along the selected paths over time. It’s a compact, intuitive summary of molecular travel.

Customize and Inspect
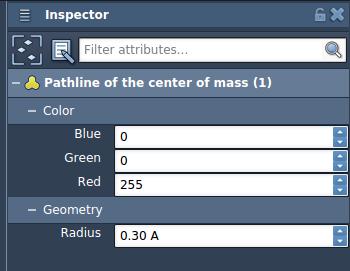
The visual model is fully customizable through the Inspector. You can adjust thickness, color, and other properties to match your preferences or emphasize specific features.

Practical Examples
- See how a substrate moves through a transmembrane channel
- Check the variability in ligand exit pathways across multiple simulations
- Use in figures or animations to show exact COM travel over simulation time
Visualizing these motions using center-of-mass pathlines takes just minutes and doesn’t require data exports, extra scripts, or plugins beyond what SAMSON already provides.
Learn more in the full Pathlines tutorial.
SAMSON and all SAMSON Extensions are free for non-commercial use. You can download SAMSON at https://www.samson-connect.net.


