


When molecular modelers perform virtual screening or docking of ligand libraries, one common challenge is managing and interpreting the output. The task doesn’t end with docking — in fact, that’s just the beginning. Making sense of hundreds (or thousands) of predicted poses and interaction data can quickly become overwhelming without the right tools. Fortunately, the AutoDock Vina Extended extension in SAMSON provides a comprehensive set of features that makes analyzing protein-ligand docking results easier and more insightful.
Let’s go over some practical ways to explore, filter, and interpret your docking results using the Results tab.
Looking Beyond Scores
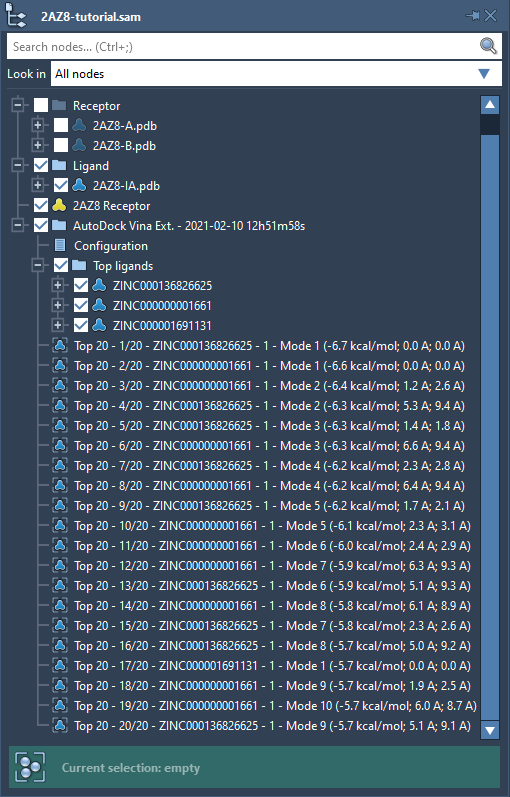
Immediately after docking, SAMSON organizes the results in a dedicated folder structure. Each ligand that was docked comes with its associated conformations, saved as structural models. The results also include a configuration node that stores the docking parameters. This is helpful for reproducibility and documentation.
To inspect these results:
- Use the Document view to expand the
Top ligandsfolder. - Double-click a conformation to restore its 3D pose in the Viewport.
- Right-click and select Create structural models from conformations to better visualize conformational clusters.
Filtering and Sorting for Insight
The Results tab is more than just a spreadsheet — think of it as your docking control center. You can:
- Sort by any column (e.g., affinity, RMSD, ligand name).
- Copy data to the clipboard.
- Export the complete table in CSV format.
- Filter by affinity thresholds or compound names to narrow down your hits.
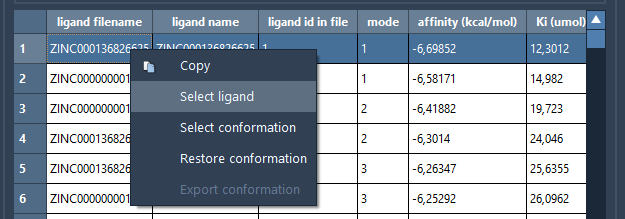
Right-clicking on a ligand entry in the table reveals options like restoring conformations or exporting structures for modeling downstream workflows.
Visualizing Affinities with the Plot
The integrated plot provides a quick visual snapshot of how each ligand performed. You can:
- Click any point to highlight the corresponding ligand.
- Double-click to instantly restore that ligand’s pose in the Viewport.
- Export the plot as an image or as raw CSV data.
The plot dynamically responds to filters, so as you adjust filters in the table, the plot updates accordingly — this helps identify trends and outliers quickly.
Loading Results Across Sessions
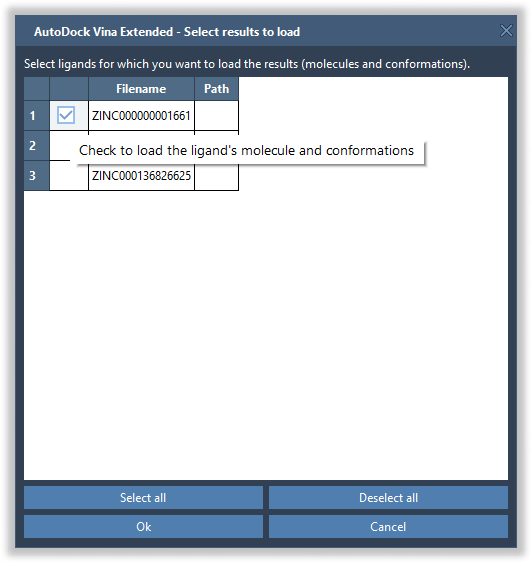
If you previously saved your docking results and want to revisit them, SAMSON allows selective loading of data – no need to load everything at once. This is especially useful for large ligand libraries.
Options include:
- Only load the score table (fastest).
- Load top N scoring ligands with conformations.
- Select specific ligands to load results for.
This modular loading approach keeps your workflow responsive and memory-efficient.
Toward Actionable Decisions
Being able to interact with the results — visualize top poses, inspect affinities in context, and annotate or export specific hits — transforms static docking output into actionable hypotheses. This workflow within SAMSON removes much of the manual overhead and file management traditionally associated with virtual screening analysis.
For more detailed steps, tips, and example images, check out the full documentation here.
SAMSON and all SAMSON Extensions are free for non-commercial use. You can download SAMSON at https://www.samson-connect.net.