


One of the common challenges in molecular modeling—especially when working with drug discovery or protein-ligand interaction—is understanding how a ligand moves as it unbinds from a protein. Visualizing this motion not only helps interpret simulation results but also improves communication with collaborators and guides future experimental or computational studies.
Pathlines, a visual model available in SAMSON, offers a simple way to trace the center-of-mass (COM) trajectory of a group of atoms (e.g., a ligand) across a path, such as those generated with the Ligand Path Finder extension. In this post, we explore how to use Pathlines for one particularly useful application: visualizing ligand unbinding routes.
Why Visualize Unbinding Routes?
- To gain insight into possible exit pathways or channel dynamics.
- To validate or analyze data from biased simulations.
- To prepare visuals for presentations or publications showing COM displacements.
Setting Up: Sample System
Start by opening SAMSON and downloading the example file. Paste the following URL in Home > Download:
https://www.samson-connect.net/documents/046f1acd-c799-40f6-8185-cb4847eff795
This document contains a model of Lactose permease (1PV7) and its ligand Thiodigalactosid (TDG) paired with unbinding trajectories. These were generated using the Ligand Path Finder extension.

Selecting the Atoms and the Paths
In the Document view, identify and select the TDG ligand. You can Ctrl-click on the ligand node to select it. Then, select one or both of the unbinding paths beneath it. If you prefer, leave paths unselected to consider all available ones.

Creating the Pathline Model
Once your selections are made, go to Visualization > Visual model > More… and choose Pathline of the center of mass. Alternatively, use the shortcut Ctrl/Cmd + Shift+V.
Click OK, and a visual pathline showing the COM movement of the ligand along the selected path(s) will be created.

Inspect and Customize
Double-clicking the path starts or stops its animation, allowing you to watch the ligand transition. In the Inspector, you can change the color, thickness, and other visual attributes of the pathline to better match your presentation or analysis needs.

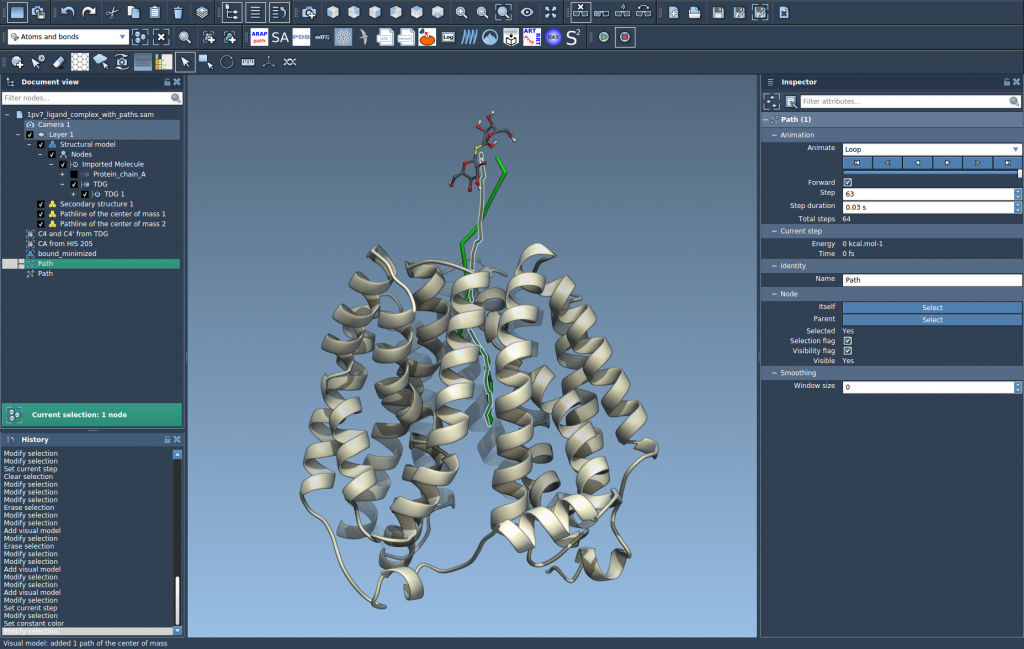
Final View
By toggling between the first and last frames of the trajectory and zooming into specific regions, you can better understand where and how the ligand exits the protein structure.

Conclusion
If you’ve ever struggled to present or interpret the motion of a ligand in a dynamic system, Pathlines provide a practical and visually intuitive solution. They help you describe ligand unbinding scenarios precisely, and you can easily export the views as images or videos using SAMSON’s built-in tools.
To learn more, visit the official documentation here: https://documentation.samson-connect.net/tutorials/pathlines/pathlines/
SAMSON and all SAMSON Extensions are free for non-commercial use. You can download SAMSON from https://www.samson-connect.net.