


One of the ongoing challenges in molecular modeling is making sure protein structures are valid enough for simulation. Protein refinement workflows often reveal residues that don’t quite fit the geometric or energetic expectations—outliers in backbone conformation. These strained residues can lead to unstable simulations, misleading results, or wasted compute cycles.
Fortunately, there’s an intuitive and visual way to validate and tweak these structural issues before hitting the simulation button: using the Interactive Ramachandran Plot Extension in SAMSON. This tool lets you quickly identify residues with unusual dihedral angles (ϕ and ψ), explore their position in the protein structure, and—best of all—edit them interactively.
Why the Ramachandran Plot Matters
Ramachandran plots display the allowed and disallowed conformations of protein backbone dihedral angles. In practice, this means they help you catch residues that have geometries incompatible with standard protein folds. These could be errors in data, artifacts from modeling, or realistic but rare conformations that deserve closer inspection.
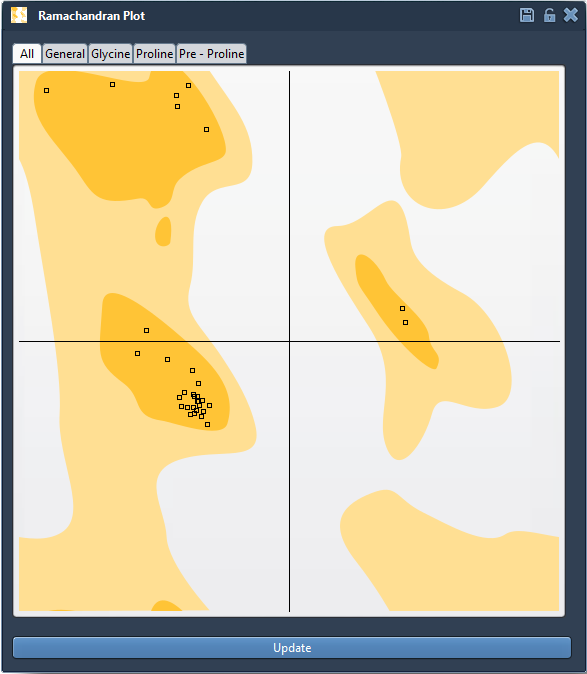
In the plot above, yellow areas represent energetically favorable regions. Dots outside these zones fall into sterically or energetically unfavorable conformations. That’s where you want to pay attention.
Spot Problems, Click to Investigate
With the Interactive Ramachandran Plot Extension, you don’t need to jump between tools to investigate outliers. Just click on a residue (dot) in the plot, and it becomes highlighted in the 3D viewport. You can immediately see which part of your protein might be problematic.
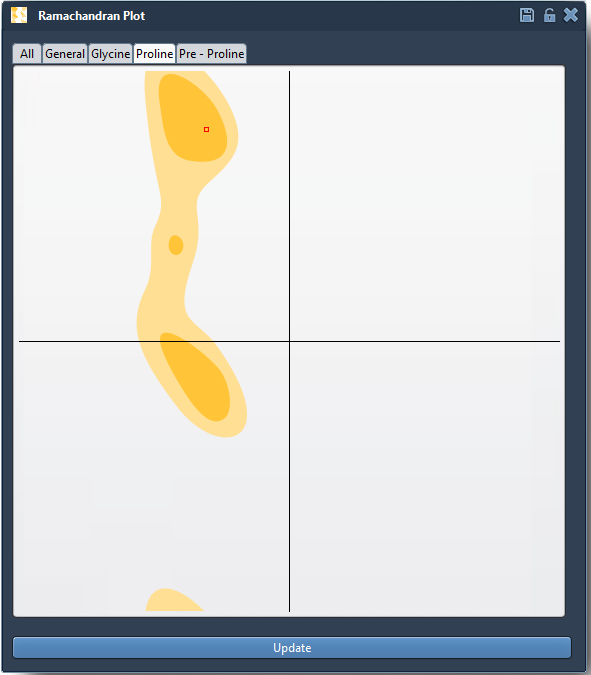
The status bar shows the exact dihedral angles of the selected residue, so you can compare it with standard ranges for different residue types (General, Glycine, Proline, etc.).
Fix It in Place
There are two ways to edit conformations directly from the plot:
1. Drag the Point on the Plot
- Click and drag a dot to move it into an allowed region (e.g., a yellow area).
- The 3D structure updates in real time based on your change.
- Undo easily with Ctrl/Cmd + Z if needed.
2. Use the Twister Editor
- Select the Twister icon from the left-hand menu.
- Click and twist residues in the structure to adjust ϕ and ψ angles.
- The Ramachandran plot updates accordingly, showing you where your residues land.
When to Use It
- Before running simulations, to avoid spending time on unstable runs.
- To refine homology models where backbone geometry may be distorted.
- To isolate and understand flexible regions (like loop closures or binding site shifts).
If you regularly work with molecular dynamics or structure prediction, adding this quick validation and editing step to your workflow can make a big difference.
Learn more at the official documentation page: Interactive Ramachandran Plot Documentation.
SAMSON and all SAMSON Extensions are free for non-commercial use. You can get SAMSON at https://www.samson-connect.net.