


When working with molecular simulations, one recurring challenge is making sense of how parts of a molecular system move over time. Whether it’s a ligand unbinding from a protein pocket, a domain shift in a protein complex, or atoms diffusing through a membrane, visualizing these dynamic behaviors in an intuitive way is key.
This is where the Pathlines visual model in SAMSON can help. It allows you to display the 3D trajectory of the center of mass (COM) of atoms in motion, offering a high-level overview of changes that occur across simulations — in a form that’s clear, customizable, and directly linked to the underlying molecular model.
What are Pathlines Good For?
Pathlines are particularly helpful for:
- Observing ligand unbinding or rebinding steps in drug-protein interactions.
- Tracking the center-of-mass displacement of groups of atoms during conformational transitions.
- Analyzing movement along predicted or sampled tunnel pathways.
Creating a COM Pathline in SAMSON
Creating a pathline is a straightforward 3-step process:
- Select atoms and a path: Open the Document view and select the atoms whose COM you want to track, as well as the relevant path or paths. You can select multiple items by holding the Ctrl / Cmd key.
- Add a Pathline visual model by navigating to Visualization > Visual model > More… or pressing Ctrl/Cmd + Shift + V. Then choose Pathline of the center of mass and click OK.
- Customize and explore: You can adjust the appearance (color, thickness) of your pathline via the Inspector. You can also play, pause, or scrub through the path by interacting with it in the Document view.

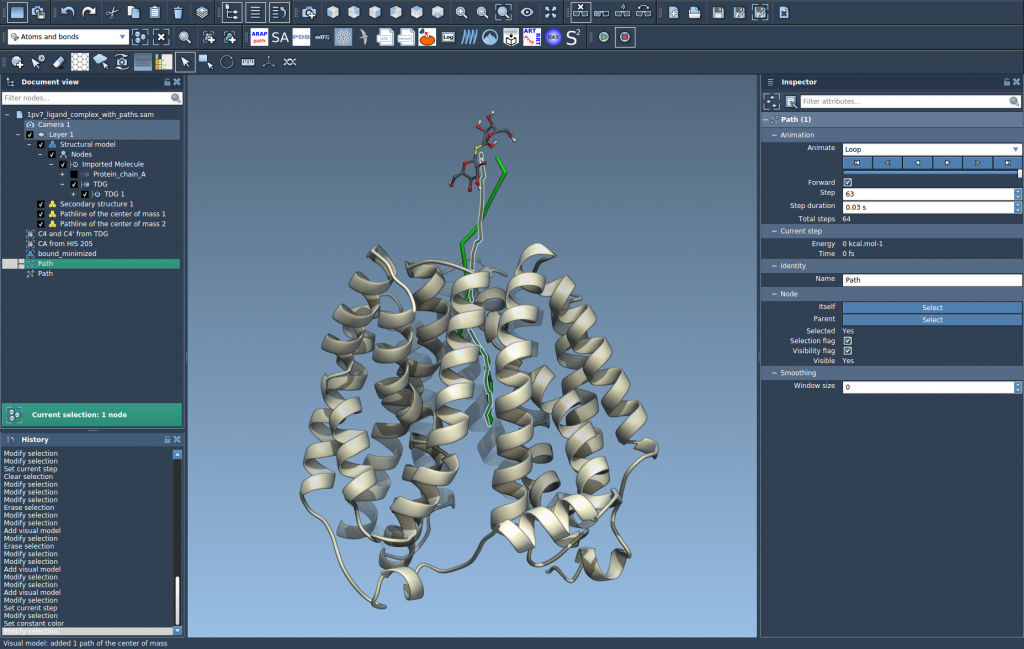
Sample Case: Ligand Unbinding in Lactose Permease
To get started quickly, SAMSON provides a sample document that shows the unbinding paths of a ligand (thiodigalactosid) from the Lactose permease protein structure (1PV7).
You can load the sample by going to:
Home > Download and pasting the following URL:
|
1 |
https://www.samson-connect.net/documents/046f1acd-c799-40f6-8185-cb4847eff795 |
Once loaded, you’ll be able to immediately create a pathline of the ligand’s center-of-mass motion along a selected path — ideal for illustrating how and where the ligand exits the binding pocket.


A Few Extra Tips
- You can double-click on a path to play or pause its motion.
- Deleting a path will remove its associated pathline.
- Deleting atoms that are part of a pathline will update the visualization accordingly.
This makes pathlines not just a visualization tool, but an interactive part of a simulation environment — providing scientists and students with deeper insights into molecular dynamics.
To learn more, visit the full Pathlines tutorial: Pathlines documentation.
SAMSON and all SAMSON Extensions are free for non-commercial use. Ready to try it out? You can get SAMSON at https://www.samson-connect.net.