



Visualizing the movement of molecules in dynamic simulations is a key challenge for many molecular modelers. Whether you’re studying ligand unbinding, protein conformational changes, or diffusion processes, being able to trace how molecules or groups of atoms move as a whole is crucial. This is where the Pathlines visual model in SAMSON comes in, allowing you to visualize center-of-mass (COM) motion in your molecular systems with clarity and precision.
Why this matters for molecular modelers
One of the biggest pains in molecular modeling is gaining an intuitive understanding of complex dynamics, especially when analyzing the motion of specific components like ligands, residues, or domains. For example, imagine studying how a ligand moves within a protein binding site. A common question is: what is the trajectory of the center of mass of the ligand, and how does it correlate with its unbinding path?
The Pathlines visual model addresses this by simplifying the tracking of COM motion along predefined paths. Whether you’re analyzing unbinding routes or collective domain movements, this tool provides a clean, straightforward visual representation of motion in your system.
How to get started with Pathlines
To use Pathlines in SAMSON, here are the steps:
Step 1: Load your sample system
If you’re new to Pathlines, try starting with the provided Lactose permease (1PV7) sample system:
- Download the system using the link here.
- The sample includes the protein, a ligand, and paths generated using the Ligand Path Finder extension. You’ll find everything preconfigured to follow this tutorial.

Step 2: Select your atoms and paths
Next, select the group of atoms for which you want to visualize their COM motion. In the Document view, hold Ctrl (or Cmd on Mac) to select multiple nodes. If you don’t select any atoms, the entire system will be used by default. Similarly, you can also choose one or more paths in the system—if not, all available paths will be considered.

Step 3: Create your Pathline Visual Model
After selecting the appropriate atoms and paths, create the pathline visual model:
- Go to Visualization > Visual model > More… in the toolbar. (Shortcut: Ctrl/Cmd + Shift + V).
- Select Pathline of the center of mass in the dialog box and click OK.
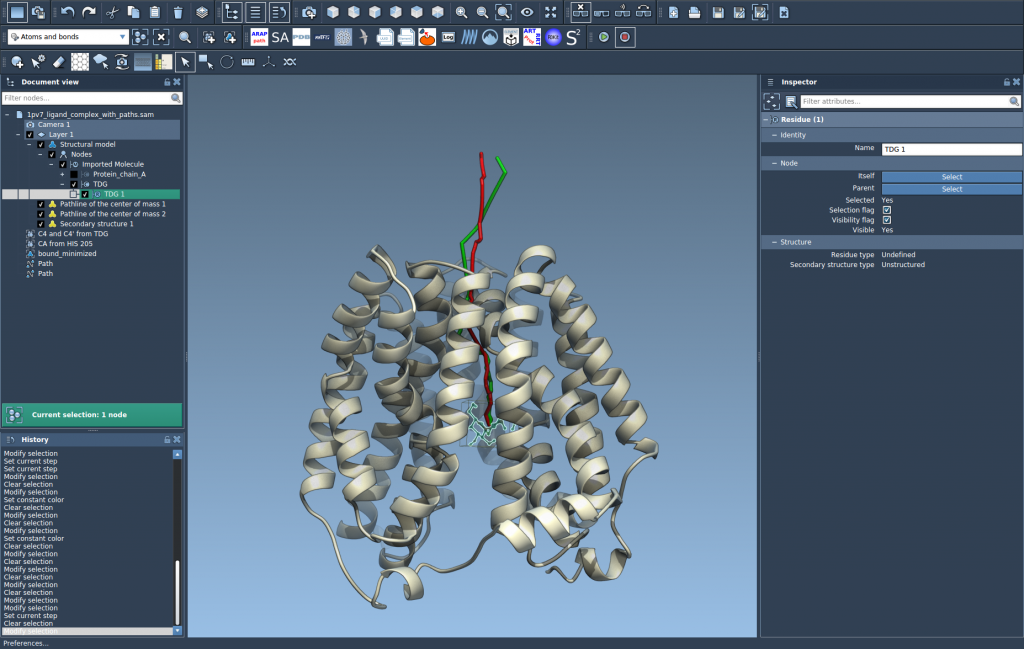
Your visual model will now display the COM motion of the selected atoms along your chosen paths, providing immediate insights. For example:
Step 4: Explore and Customize
- Manipulate paths directly in the Document view. For example, double-click on a path to start or stop it.
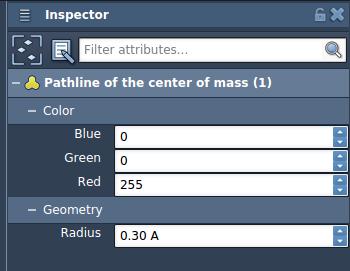
- Adjust attributes like path color or thickness in the Inspector.
- Right-click on a path to access additional options.
Real-world applications of Pathlines
Pathlines have numerous applications in molecular modeling, for example:
- Visualizing ligand unbinding and rebinding routes.
- Analyzing collective domain motions in protein complexes.
- Understanding COM movement in reaction coordinate workflows.
Ready to dive deeper?
Pathlines are a versatile tool that can simplify understanding complex molecular dynamics. To explore the complete tutorial and gain a deeper understanding of how to implement this in your own systems, visit the official Pathlines documentation.
Note: SAMSON and all SAMSON Extensions are free for non-commercial use. Get SAMSON at https://www.samson-connect.net.