


For molecular modelers, ensuring that protein structures conform to energetically favorable backbone angles is a crucial step in refining models. Strained residues in inappropriate conformations lead to instability, limit simulation success, or even produce inaccurate results. The Ramachandran Plot, integrated into the SAMSON molecular design platform, provides a powerful way to identify and fix these issues.
What is the Ramachandran Plot?
A Ramachandran plot graphically maps the phi (φ) and psi (ψ) dihedral angles of protein residues, highlighting regions of permitted and forbidden conformations. With the SAMSON Interactive Ramachandran Plot Extension, you can simultaneously analyze and edit residue conformations. This ensures your structures adhere to steric and energetic principles, ultimately improving their overall stability.
How it Works in Practice
Generating and Visualizing the Plot
Begin by loading your protein structure. Use SAMSON’s built-in tools to fetch a protein (for example, PDB ID 1YRF). Simply go to Home > Fetch, type the desired ID, and click load. Once the structure is ready, open the Ramachandran Plot app via Home > Apps > Biology > Ramachandran Plot.
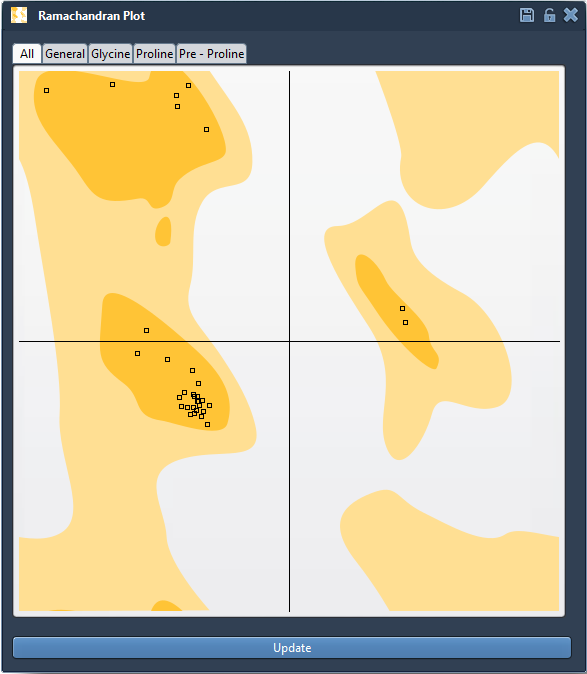
The generated plot categorizes residues by energetically favorable and unfavorable regions:
- Yellow regions: energetically favorable conformations.
- White regions: energetically unfavorable conformations.
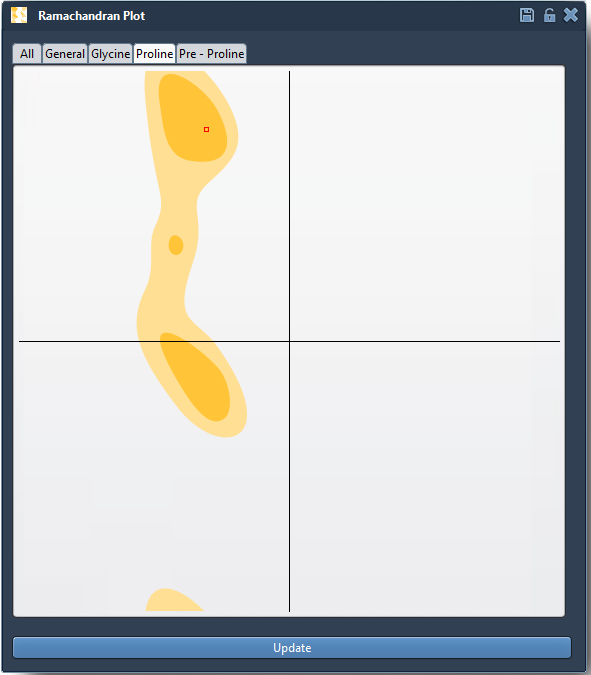
Residues are displayed as points on the plot, with categories like glycine, proline, and pre-proline available for specialized filtering.
Select and Refine Residues
One of the plot’s standout features is interactivity — enabling direct, visual editing of selected residues. For example, clicking on a residue point in the plot automatically highlights it in the 3D viewport, displaying its φ and ψ values in the status bar. This dual-visualization ensures clarity and precision during conformation adjustments.
Interactive Refinement Techniques
The SAMSON Extension offers two powerful ways to edit backbone angles:
- Drag points within the plot: Simply move a point in real time to update its φ and ψ angles. Changes reflect instantly in the 3D structure. Mistakes can be undone via Ctrl/Cmd + Z.
- Twister Editor: This editor (accessed via the left-hand viewport menu) allows users to twist the protein in 3D space. Observing the simultaneous live update on the Ramachandran plot ensures both local flexibility and global structure accuracy are respected.
Why is this Essential?
Using the Ramachandran plot to refine protein backbone conformations isn’t just a theoretical exercise. By iteratively analyzing and adjusting outliers, researchers can:
- Detect and fix strained residues to ensure stable simulations.
- Perfect homology models by rectifying outlier conformations.
- Optimize structures for functional studies, such as active site flexibility.
Through its integration in SAMSON, this powerful visualization and editing tool bridges the gap between raw structural data and refined molecular design.
To learn more about how to incorporate the Ramachandran plot into your modeling workflows, visit the official SAMSON documentation.
Note: SAMSON and all SAMSON Extensions are free for non-commercial use. Download SAMSON at https://www.samson-connect.net.