



When comparing protein structures along a path, it is easy to miss gradual changes. A helix may shorten, a loop may become more ordered, or one region may shift from beta structure toward an unstructured state—while the overall shape still looks familiar. Inspecting frames one by one can make these trends difficult to see, especially when the selection contains many residues.
A useful first step is to turn the structural change into a simple question: How does the balance of alpha, beta, and unstructured residues change from frame to frame? In SAMSON’s Path Analyzer, the Secondary structure content observable summarizes that balance as percentages across a path. It gives you a compact overview before you investigate individual residues.
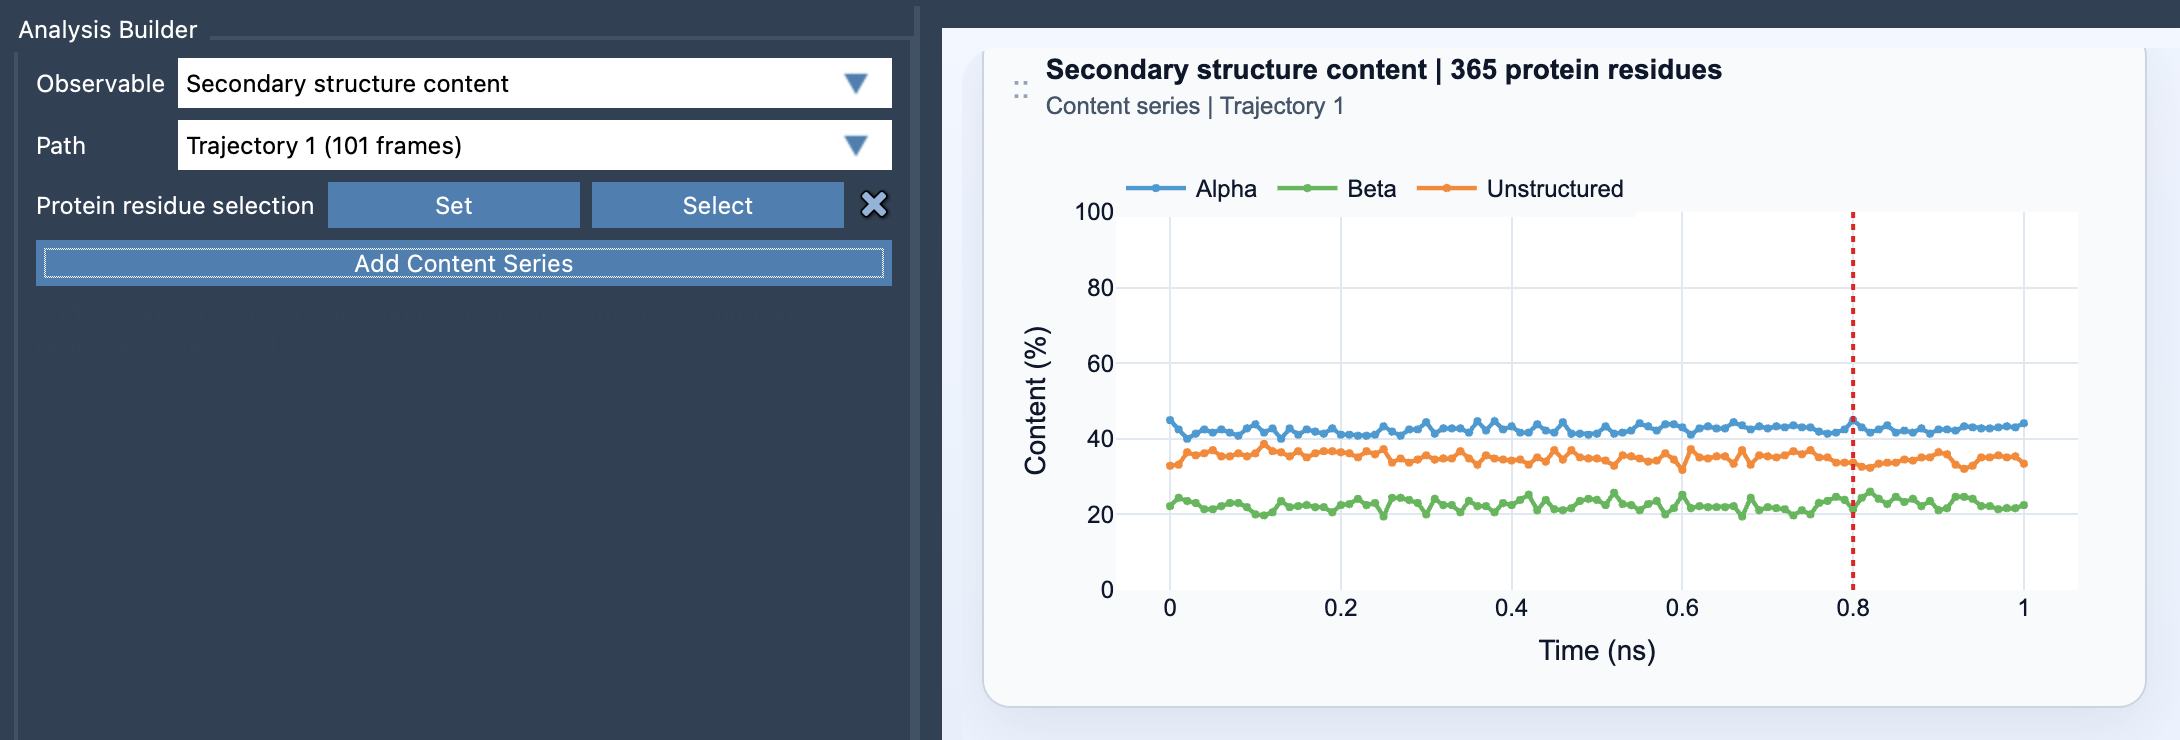
What the plot tells you
For each frame, the analysis reports three values: the percentage of selected residues assigned to Alpha, Beta, and Unstructured. Each percentage is calculated by dividing the count of residues in that category by the total number of selected protein residues, then multiplying by 100. In other words, the plot shows composition—not the position of each residue or the size of its structural change.
That distinction helps set expectations. A curve changing over the path tells you that the selected protein region’s secondary-structure makeup is changing. By itself, it does not tell you which specific residues caused the change, what physical event caused it, or whether that change is biologically meaningful. Treat the plot as a guide to where closer inspection may be useful, rather than a complete explanation of the motion.
Choose the selection to match the question
If you want a protein-wide overview, use a broad selection of protein residues. This can help answer questions such as whether the overall structure becomes more or less alpha-helical, or whether beta content changes along the path.
If you already have a region in mind, focus the selection on a domain, helix bundle, or loop-rich segment. A whole-protein percentage can conceal a localized change: one small region may reorganize while the rest of the protein remains stable. A focused selection makes that region’s contribution easier to see. Keep track of exactly what you selected when comparing plots, since the percentages are normalized to the selected residue count.
A practical reading workflow
- Open Path Analyzer, choose Secondary structure content as the observable, and select the path you want to inspect.
- Define a protein residue selection. The selection needs to contain atoms belonging to protein residues.
- Click Add Content Series to create the plot.
- Look for changes in the three curves across frames. Note where the trend begins, whether it continues or reverses, and whether one category changes alongside another.
- Use the plot to decide which frames or regions deserve a closer structural inspection. For residue-level backbone detail, pair this overview with the Ramachandran analysis.
This approach is particularly useful when you need to summarize a long structural path without relying only on visual impressions. The plot provides a consistent, frame-by-frame measure of secondary-structure composition, while a carefully chosen selection keeps the summary relevant to the question you are asking.
For setup details and the definitions used by the analysis, see the Secondary Structure Content documentation.
Note: SAMSON and all SAMSON Extensions are free for non-commercial use. Get SAMSON.