


For molecular modelers, visualizing protein structures accurately is a critical task. But maintaining insight into the conformational constraints of residues can be challenging without the right tools. The Interactive Ramachandran Plot Extension for SAMSON provides a user-friendly solution to visualize and analyze protein backbone dihedral angles through a powerful, interactive plot. This guide explains how to get started with protein visualization using this tool.
Preparing Your Environment
To get started, ensure you have the Interactive Ramachandran Plot installed:
- Log into SAMSON Connect.
- Go to the extension page and click Add.
- Restart SAMSON to activate the extension.
Once set up, you’re ready to load a protein of your choice and make use of the Ramachandran plot app.
Loading a Protein Structure
With SAMSON, loading protein structures is a fast and straightforward process. This example uses the PDB ID 1YRF:
- Navigate to Home > Fetch in SAMSON.
- Enter
1YRFin the structure input field (PDB or PDB mmCIF formats). - Click Load to fetch the structure directly.
You can follow a similar workflow for other proteins, depending on your research or modeling needs.
Using the Ramachandran Plot App
Once the structure is loaded, you can open the Ramachandran plot app:
- Go to Home > Apps > Biology > Ramachandran Plot.
- Click Update to generate the plot.
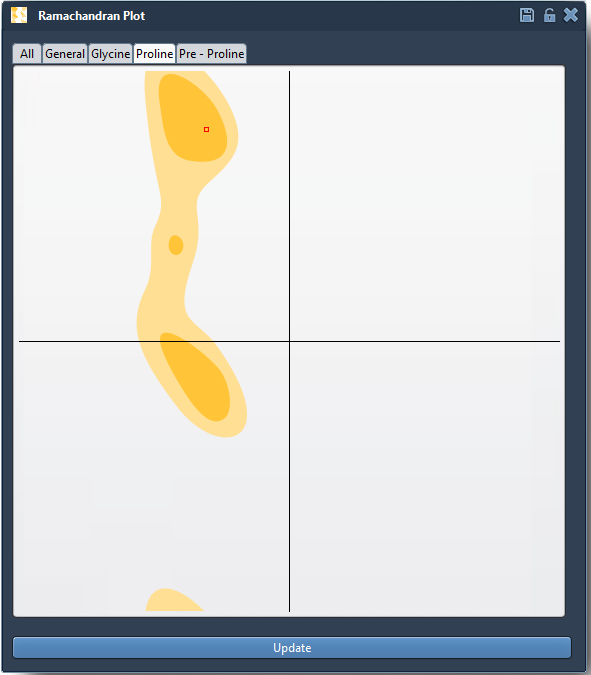
The Ramachandran plot will appear, categorizing residues into yellow areas (energetically favorable) and white areas (energetically unfavorable). A practical feature of the app is its tab system, enabling you to filter residues by type:
- All
- General
- Glycine
- Proline
- Pre-proline (residues just before prolines in the amino acid chain)
Visual Exploration Made Easy
Clicking on any data point in the plot highlights the corresponding residue in the 3D viewport. Let’s say you’re working with a proline residue – you can click on its dot in the plot. The selected residue is synchronized in the main viewport, and the precise φ (phi) and ψ (psi) dihedral angles appear in the status bar below:
This functionality is perfect for identifying outliers or validating residue conformations prior to running simulations or refining homology models.
Apply It to Your Protein-Modeling Workflows
The Ramachandran plot app in SAMSON lets you do more than just view protein structures – it enables analysis, fine-tuned selection, and even editing of protein backbone conformations. This makes it particularly valuable for:
- Detecting strained residues that may cause issues in simulations.
- Refining homology models by actively fixing outliers.
- Studying conformational flexibility around active or binding sites in proteins.
For molecular modelers aiming for both accuracy and efficiency, this functionality is a vital addition to any workflow.
To learn more on how to use the Interactive Ramachandran Plot Extension for analyzing and manipulating proteins, visit the detailed documentation page: Interactive Ramachandran Plot Documentation.
Note: SAMSON and all SAMSON Extensions are free for non-commercial use. You can get SAMSON at this link.