If you’re using umbrella sampling in GROMACS to estimate free energy profiles, you probably already know how time-consuming the simulations can be. What’s even more frustrating is the uncertainty: did the sampling fully cover the reaction coordinate space? Were there enough overlaps? Is your Potential of Mean Force (PMF) converged?
In this post, we’ll explore a concrete way to check that—without digging through histograms manually or writing additional scripts—using the PMF Analysis feature in the GROMACS Wizard Extension for SAMSON. Whether you’re a beginner or experienced in molecular dynamics, this tool might save you hours of repetitive work.
Why Convergence Checking Matters
Without convergence, your PMF results can’t be trusted for comparing binding strengths, reaction barriers, or anything quantitative. Checking coverage of the reaction coordinate and histogram overlap is essential to verify that your biasing strategy was successful—and to decide where umbrella windows may be missing or under-sampled.
Folder Structure: The Starting Point
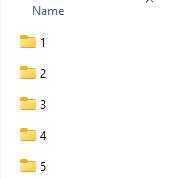
PMF Analysis in GROMACS Wizard assumes you’ve run simulations organized into folders—ideally from a prior umbrella sampling, possibly executed via batch computations. The folder structure matters: it should contain numbered subfolders (0, 1, 2, …) with simulation results for each umbrella window. These should all correspond to the same system and the same reaction coordinate.

Using WHAM Analysis with GROMACS Wizard
To start analyzing your data, switch to the WHAM Analysis tab inside the GROMACS Wizard. If you’re continuing from an umbrella sampling step, just click the auto-fill button to pull in the relevant project path automatically:
![]()
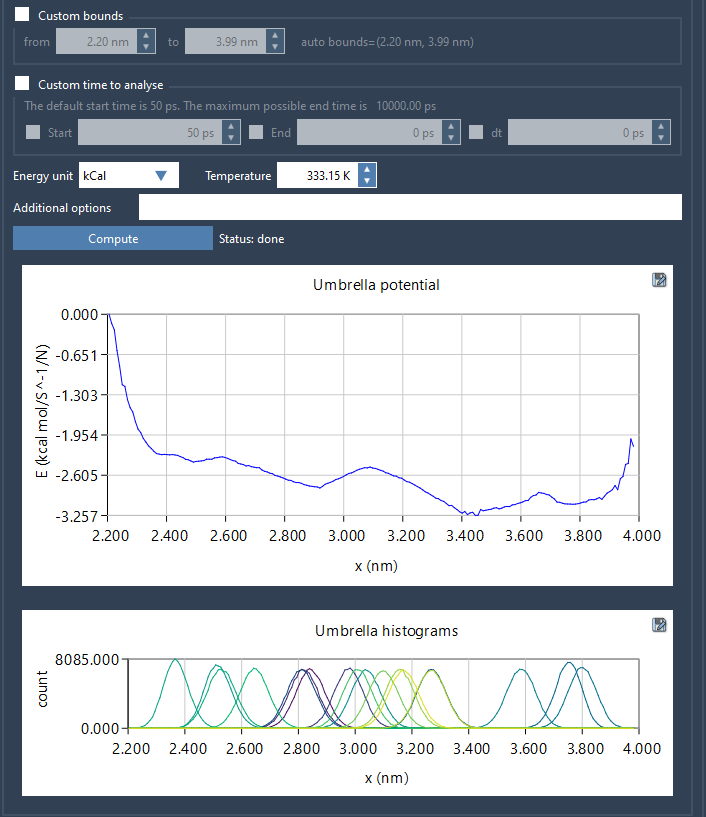
Next, select the desired reaction coordinate from the dropdown list. You can optionally fine-tune options like bounds, time ranges, or energy units. Then hit Compute.
Interpreting the Output
Two plots will be generated:
- A PMF profile along your reaction coordinate
- A histogram plot showing how well each region is sampled

The second plot in particular is your friend. It shows how each umbrella window contributed to the total sampling and whether you had ample overlap between windows (a requirement for WHAM to produce reliable estimates).
Spikes or gaps in the histogram might indicate that a certain region needs more sampling—perhaps by running a longer simulation or inserting new umbrella windows.
Reusing and Saving Results
Calculated results are stored automatically in a wham_results folder inside your project. If you later decide to switch between reaction coordinates or experiment with different bounds or times, the Wizard will check if those results already exist and re-use them—minimizing unnecessary re-computation.
Takeaway
Checking for convergence doesn’t need to be a manual and tedious process. With this WHAM-based interface, you can visualize coverage across your reaction coordinate in just a few clicks. It’s an essential step to validate your umbrella sampling simulations—and ultimately ensure your PMF is meaningful.
Learn more in the official documentation.
SAMSON and all SAMSON Extensions are free for non-commercial use, and you can download SAMSON here.


