


Molecular modelers often need to understand how small molecules (ligands) move in and out of binding pockets in proteins. Whether you’re studying unbinding mechanisms for drug design or analyzing ligand diffusion paths through protein tunnels, visualizing these motions helps make sense of complex simulations.
But even with the right simulation data, extracting and interpreting the motion of specific atoms—like the center of mass (COM) of a ligand along a simulation path—can be time-consuming. This is where the Pathlines feature in SAMSON provides a straightforward solution.
Visualizing the Center-of-Mass Trajectory
The Pathlines extension lets you easily create a visual trace of how a group of atoms (commonly a ligand) moves over time in the simulation. This path is represented as a smooth line that follows the COM of the selected atoms along predefined transition paths—like those generated using tools such as Ligand Path Finder in SAMSON.
You can use this to:
- Visualize alternative ligand unbinding or rebinding routes
- Compare motion through different channels in a protein
- Analyze displacement of ligands in response to conformational changes
Step-by-Step: Creating a COM Pathline
Here’s how you can quickly generate a COM pathline for a ligand:
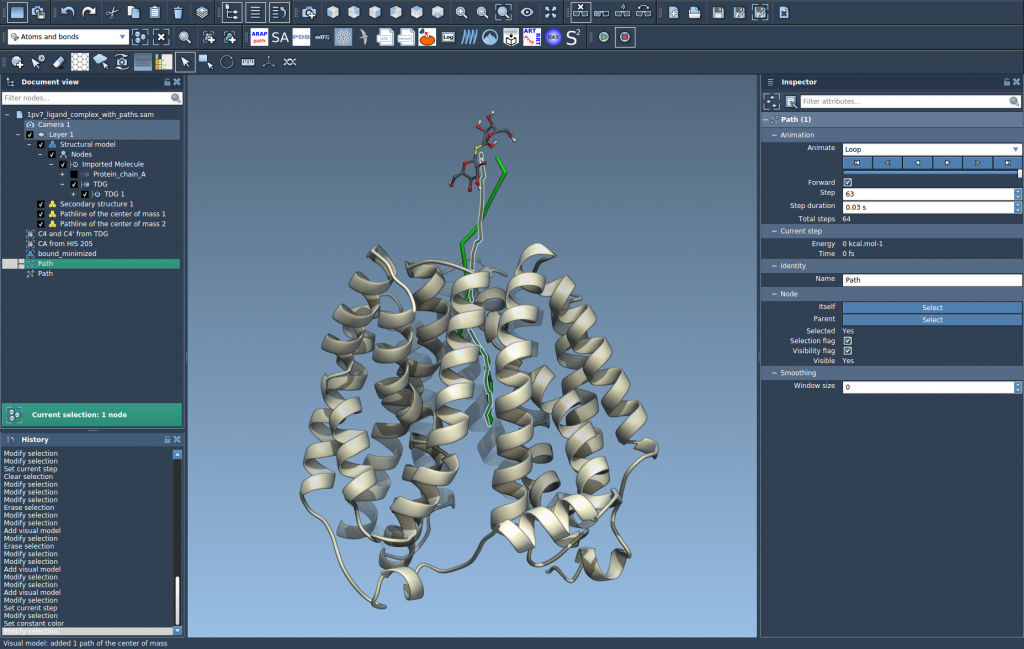
- Load your system: You can follow the Pathlines tutorial using the sample structure of lactose permease (
1PV7) bound to thiodigalactosid (TDG). You can download the sample document directly from this link. - Select atoms and paths: In the Document View, select the group of atoms you want to track—typically the ligand—and one or more paths. If you don’t select atoms, the entire model is used. If you don’t select paths, all available paths are used.

- Create the Pathline visual model: Go to
Visualization > Visual Model > More...and choose Pathline of the center of mass.

- Explore the visualization: The line will now trace the motion of the selected atoms. You can play back paths by double-clicking them or further customize color, style, and thickness through the Inspector panel.

When to Use This
This method is useful when you need quick and clear visual feedback on ligand motion—especially in screening multiple unbinding routes or assessing how geometrical constraints affect ligands’ trajectories. It complements analysis pipelines without additional scripting or export steps.
If you’re exploring new binding pocket designs or optimizing exit pathways, this lightweight COM-based tracking can help you decide where to focus detailed analysis.
Learn more in the official Pathlines tutorial documentation.
SAMSON and all SAMSON Extensions are free for non-commercial use. You can get SAMSON at https://www.samson-connect.net.