


Tracking the motion of molecules is a key task for molecular modelers studying processes like ligand binding, protein conformational changes, or diffusion. The Pathlines visual model in the SAMSON molecular design platform provides an intuitive way to visualize the center-of-mass (COM) trajectories of selected atomic systems. Below, we’ll guide you through how to utilize this tool effectively for your molecular modeling work.
What Are Pathlines?
Pathlines allow you to visualize the displacement of the center of mass of selected atoms over a defined path, helping you observe behaviors such as ligand unbinding, domain motions in macromolecular systems, or atomic diffusion. Imagine being able to create a bird’s-eye view of how specific atom groups move throughout your simulations—this is precisely what Pathlines offers.
Step 1: Loading a Sample System
Getting started is simple. SAMSON provides a sample structural document for practicing with Pathlines:
- Click Home > Download in SAMSON.
- Paste this document link into the download dialog:
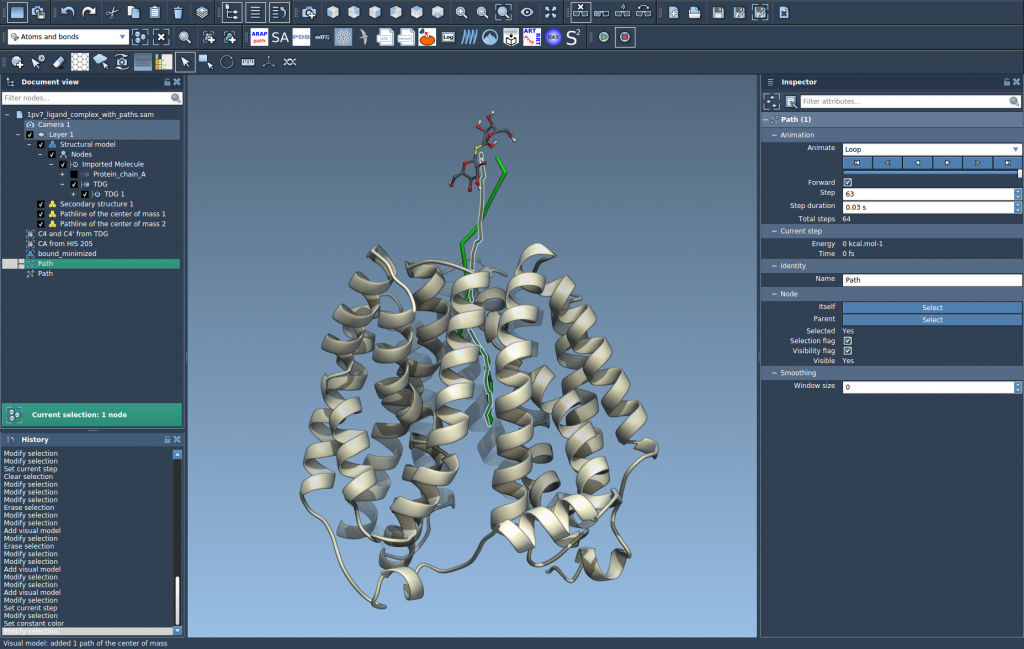
https://www.samson-connect.net/documents/046f1acd-c799-40f6-8185-cb4847eff795. - Click Download. The sample features Lactose permease (PDB code:
1PV7) with its ligand Thiodigalactosid (TDG) and generated unbinding paths.

Once loaded, you’ll find the protein (under Protein_chain_A) and the ligand (under TDG) along with two precomputed paths that illustrate unbinding pathways.
Step 2: Selecting Atoms and Paths
With the sample loaded, you can select the atoms you wish to analyze and paths to visualize:
- To choose a specific group of atoms, go to the Document view, and select them.
- To include more than one atom group, hold the Ctrl (or Cmd) key while selecting.
If no selection is made, SAMSON will consider the entire atomic system and all paths by default.

Step 3: Creating a Pathline Visual Model
The core of this workflow is using Pathlines to generate visual models of atomic motion:
- Go to the menu bar and select Visualization > Visual model > More…. You can also use the shortcut Ctrl/Cmd + Shift + V.
- In the dialog that appears, select Pathline of the center of mass and click OK.

This generates a visual model of the selected atom group’s COM motion along the specified paths, providing instantaneous insight into molecular behavior.
Step 4: Exploring and Customizing
Pathlines offer flexibility for customization and exploration:
- Double-click a path in the Document view to play or stop its visualization.
- Right-click a path for additional options under Path > ….
- Use the Inspector (Ctrl/Cmd + 2) to access path controllers. Here, you can modify attributes such as color and thickness for a more tailored depiction.
Adjusting these settings makes it easier to communicate your findings and focus on key molecular events.
Applications of Pathlines
The utility of Pathlines extends to various areas of molecular modeling, such as:
- Studying ligand unbinding and rebinding routes.
- Analyzing collective motions in protein complexes.
- Mapping center-of-mass movements in workflows involving reaction coordinates.
To dive deeper, you can view the complete documentation here.
Note: SAMSON and all SAMSON Extensions are free for non-commercial use. Get SAMSON at https://www.samson-connect.net.