Running umbrella sampling simulations to explore molecular interactions can be computationally expensive and time-consuming. But how can you be sure you’ve sampled enough of your reaction coordinate space? One of the most common pain points in molecular modeling is having to rerun imperfect simulations simply because convergence wasn’t adequately checked.
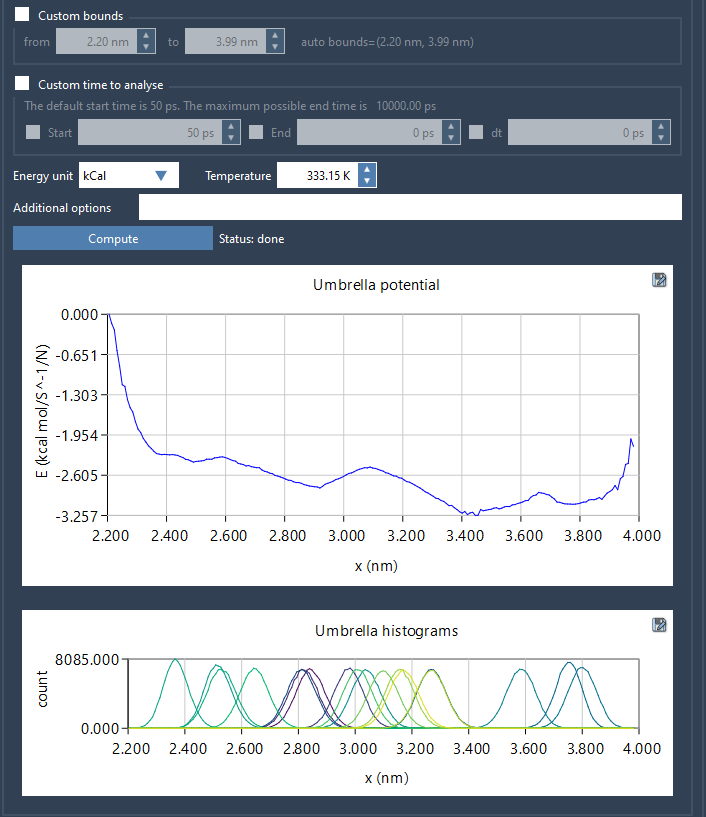
That’s where the Potential of Mean Force (PMF) analysis with WHAM (Weighted Histogram Analysis Method) in GROMACS Wizard comes in. Not only does it compute PMF curves, but it also produces histograms of sampling density along the reaction coordinate. These histograms are invaluable for visualizing where your sampling is dense, thin, or missing altogether.
Why histograms matter
The histogram generated alongside your PMF plot shows how well each interval of your reaction coordinate is covered. If some bins are empty or very sparse, your PMF results may not be reliable in those regions. This visual feedback lets you know whether:
- You need to add more windows to certain reaction coordinate ranges
- Simulations ran long enough to produce adequate overlap between windows
- The choice of reaction coordinate was suitable for your system
How to access this feature in SAMSON
After running your umbrella sampling simulations—manually or via the GROMACS Wizard’s batch computation function—go to the WHAM Analysis tab in the GROMACS Wizard interface.
If your umbrella sampling project was recently completed, just click the auto-fill button ![]() to automatically populate the correct project path. This saves time and ensures accuracy.
to automatically populate the correct project path. This saves time and ensures accuracy.

Once the system loads the necessary metadata—such as available reaction coordinates, time ranges, and temperature—just select your desired coordinate and click Compute. The tool will rapidly generate two plots: one for the PMF and another for the histogram of your umbrella sampling windows.

What to do if coverage is poor?
If your histogram reveals sparse regions, consider:
- Re-running simulations with more overlapping windows in that region
- Adjusting window centers or the force constant used in umbrella potentials
- Extending simulations to increase trajectories for underpopulated bins
The GROMACS Wizard saves all results in the wham_results subfolder. When you switch to another reaction coordinate already computed with the same project, results are loaded instantly—no need to recompute from scratch.
The histogram feature is not just a visual add-on; it’s a diagnostic tool that helps ensure confidence in your final PMF curves. Having immediate access to it in an interactive interface helps pinpoint issues before costly reruns.
To learn more, head over to the full documentation for PMF analysis in GROMACS Wizard.
SAMSON and all SAMSON Extensions are free for non-commercial use. You can get SAMSON at https://www.samson-connect.net.


