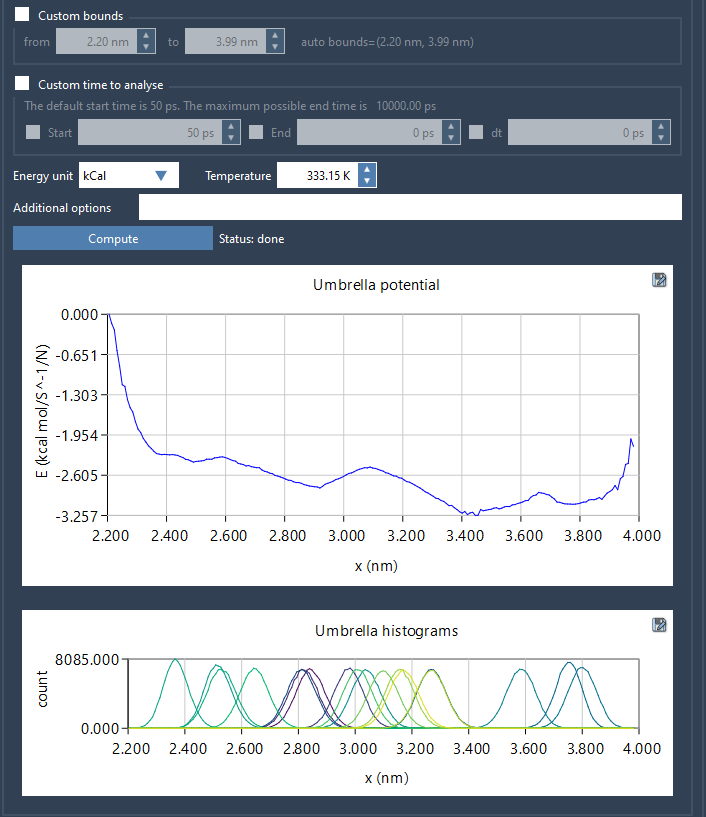
Running umbrella sampling simulations is only part of the story in calculating a Potential of Mean Force (PMF). A common challenge molecular modelers face is realizing—too late—that parts of the reaction coordinate space were not well covered, leading to unreliable PMF profiles. The good news? The GROMACS Wizard in SAMSON provides a focused, visual workflow to identify these issues up front when performing WHAM (Weighted Histogram Analysis Method) analysis.
Inaccurate PMF results often stem from poor sampling, usually when the reaction coordinate isn’t fully or evenly spanned. The histogram output from the WHAM Analysis tab in GROMACS Wizard helps prevent this. Here’s how it works, and why it’s useful.
Diagnosing Gaps Right Away
Once you load your project directory in the WHAM Analysis tab, GROMACS Wizard automatically parses subfolders for simulation data. Based on this, it builds a histogram that reflects how much sampling occurred across bins of the reaction coordinate.

The histogram gives you direct insight into the distribution of sampled configurations along the chosen coordinate. If there are large dips in the histogram, you can immediately tell that certain intervals are under-sampled—or even never visited. This is often the case in regions where the potential energy barrier is too high or the simulation windows were not spaced densely enough.
Why It Matters
Without this kind of diagnostic graph, users might interpret their PMF curves as complete when they are not. A seemingly smooth PMF can actually be the result of interpolated data from poorly sampled intervals. Having a histogram lets you backtrack before drawing conclusions—saving both time and computational effort.
A Practical Workflow
- In the GROMACS Wizard, switch to the WHAM Analysis tab.
- Click the auto-fill button
 to locate the project folder from your umbrella sampling simulations.
 - Select the desired reaction coordinate from the list.
- Click Compute. The PMF profile and histogram will be generated.
Each time you switch reaction coordinates, previously computed data is reused from the wham_results folder, making it easier to test different parameters.
Visual Guidance for Better Sampling
For many molecular modelers, one of the hardest parts is deciding where to spend additional simulation time. The histogram gives concrete direction on where to refine umbrella sampling – just look for empty or thinly populated bins.

By integrating histogram visualizations directly into the PMF workflow, the GROMACS Wizard allows users to make informed decisions early, reducing the trial-and-error burden of insufficient sampling.
Learn more in the full documentation.
SAMSON and all SAMSON Extensions are free for non-commercial use. You can download SAMSON at https://www.samson-connect.net.


