


When preparing a protein structure for simulation or analysis, molecular modelers inevitably face one common challenge: fixing strained backbone conformations. These strained residues tend to lie in disallowed regions of the Ramachandran plot and may cause downstream inaccuracies in energy calculations or dynamic behavior.
Traditionally, identifying and correcting these conformations can be slow and iterative. But the Interactive Ramachandran Plot extension in SAMSON offers a hands-on visual approach to tackle this problem directly from within your 3D environment.
Quick Overview of the Ramachandran Plot
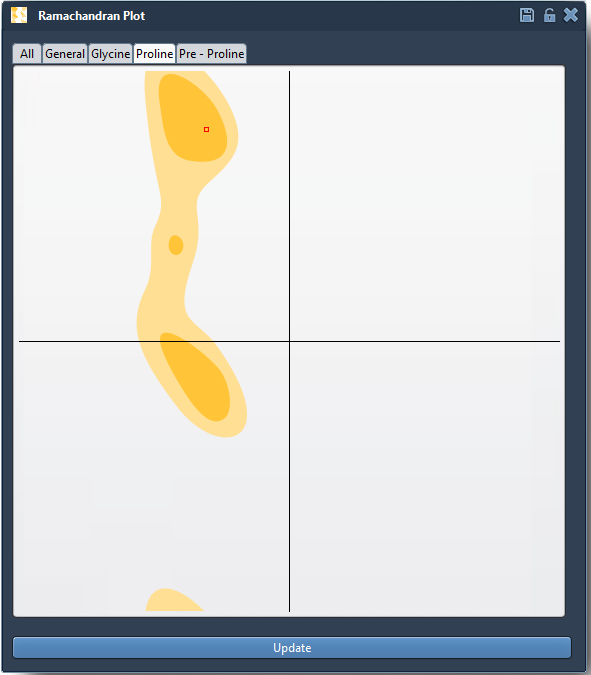
A Ramachandran plot maps the φ (phi) and ψ (psi) dihedral angles in a protein’s backbone, showing where these angles fall in terms of energetic feasibility:
- Yellow regions: Favorable conformations
- White regions: Disallowed or strained conformations
This plot is used routinely in structural biology for quality control, but what if you could do more than just see it?
Real-Time Editing from the Plot
The SAMSON Interactive Ramachandran Plot doesn’t just visualize conformations—it lets you change them directly. Here’s how:
🌐 Option 1: Drag Points on the Plot
Simply click and drag an individual dot on the plot. As it moves, the structure in the 3D viewport updates in real time to reflect the corresponding φ and ψ angles. This provides immediate feedback, making it remarkably intuitive to reposition an outlier into a favorable region.
And if you’re not happy with the result, just press Ctrl/Cmd + Z to undo.
🌀 Option 2: Use the Twister Editor
Prefer editing in 3D space? Select the Twister editor from SAMSON’s left-hand editor menu. Twist parts of the protein backbone, and the Ramachandran plot automatically updates to show the φ and ψ values. This mode is especially useful when you want spatial awareness of how residues are rearranging.
When to Use This Tool
This feature is especially handy when:
- Preparing structures from homology modeling or threading, which often include strained residues
- Refining models prior to docking or molecular dynamics
- Visually exploring the conformational flexibility of residues in active or binding sites
Why It Matters
Conventional tools may flag outliers but give little feedback on how local changes affect the rest of the structure. By coupling the Ramachandran plot interface with real-time 3D editing, modelers gain a tighter loop between validation and correction—no scripting or guesswork required.
Where to Learn More
To explore this feature in more detail, visit the full documentation page: Interactive Ramachandran Plot – Documentation.
SAMSON and all SAMSON Extensions are free for non-commercial use. You can get SAMSON at https://www.samson-connect.net.