


When working with proteins, even a single poorly-placed residue can make the difference between a stable simulation and a failed model. For molecular modelers, quickly identifying and fixing conformational outliers is more than just helpful – it’s essential. But in large structures, tracking down residues one by one can feel like looking for a needle in a haystack.
This is where the Interactive Ramachandran Plot in SAMSON proves especially useful. You can use it to visualize all backbone dihedral angles, instantly spot outliers, and select individual residues with a single click. Let’s look at how this works and what kind of insight it gives you.
Start with a familiar structure
To follow along, open any protein of your choice (this example uses 1YRF):
- Go to Home > Fetch in SAMSON.
- Enter
1YRFin the PDB search bar and click Load.
Launch the Interactive Ramachandran Plot
Once your protein is loaded, open the Ramachandran Plot from the Home > Apps > Biology menu. Click on Ramachandran plot to open the tool:
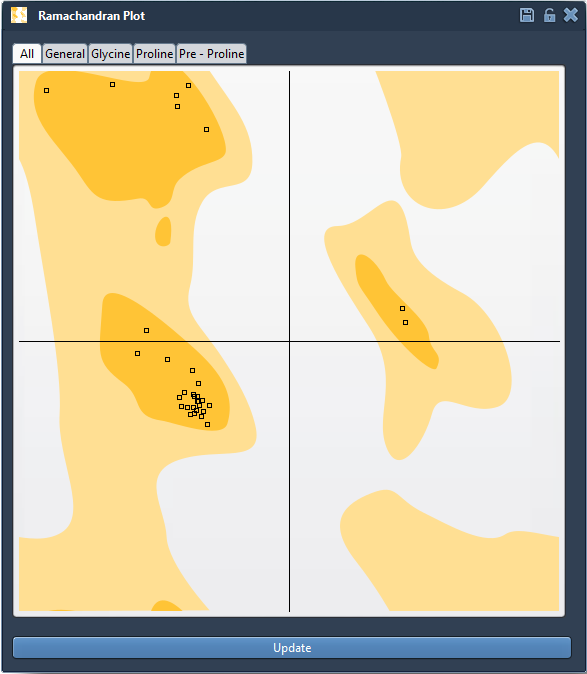
The plot shows the φ (phi) and ψ (psi) angles of each residue as dots. Yellow areas represent favored conformations, while white areas highlight regions that are energetically unfavorable. This already helps you spot residues that might need attention.
Filter and inspect specific residue types
Residues can behave differently depending on their chemical nature. Tabs above the plot allow you to filter views by:
- All
- General
- Glycine
- Proline
- Pre-proline (residues before a Proline)
This classification helps you focus your validation efforts. For instance, prolines have very restricted backbone flexibility—you may want to inspect these more closely.
Click to center and inspect a residue
Clicking on a dot in the plot highlights and centers that residue in the 3D viewport. For instance, here we’ve clicked on a proline residue:
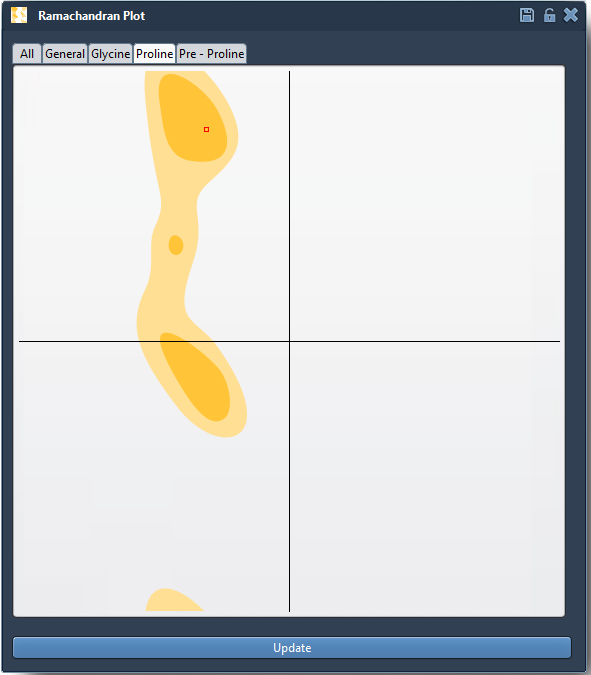
Immediately, the selected residue becomes visible in 3D, and the lower status bar shows its φ/ψ values so you can verify if it falls within expected ranges:

Why this matters
This click-to-inspect feature is especially useful when you’re doing structure validation or preparing a protein for simulation. You can:
- Quickly locate potential outliers in your structure
- Visually assess whether a residue’s conformation makes sense
- Pair this with interactive editing tools to reshape backbone angles in real time
In short, the Interactive Ramachandran Plot goes beyond visualization—it becomes a control center for both analysis and action.
Learn more by visiting the full documentation here: https://documentation.samson-connect.net/tutorials/ramachandran/ramachandran-plot/
SAMSON and all SAMSON Extensions are free for non-commercial use. You can get SAMSON at https://www.samson-connect.net.