



How to Simplify Potential of Mean Force (PMF) Analysis in Molecular Modeling
If you’re navigating molecular modeling, you’ve likely faced the challenge of accurately computing energy profiles for reactions or molecular interactions. Enter the GROMACS Wizard’s PMF analysis tool, a streamlining solution for molecular modelers aiming to save time and improve accuracy in their umbrella-sampling workflows. This blog post will walk you through how to perform PMF analysis using the Weighted Histogram Analysis Method (WHAM) in GROMACS Wizard.
Why Does PMF Analysis Matter?
PMF profiles are fundamental for understanding the energy landscape of molecular systems along a defined reaction coordinate. However, achieving accurate results without computational inefficiencies can be an uphill battle. The GROMACS Wizard simplifies this process, letting you focus on interpreting results rather than wrestling with tools. Here’s how it works.
Before You Start: Preparing for PMF Analysis
Before diving in, ensure you’ve completed an umbrella sampling workflow. Additionally, confirm that your input folder is structured properly, with matching subfolders corresponding to the same system and reaction-coordinate setup. This organization is crucial for smooth data processing.
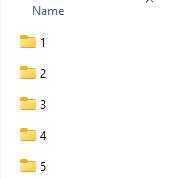
Above is an example of the type of input folder organization you need. Ensuring proper folder structure from the start avoids errors and speeds up the workflow.
Steps to Compute the PMF
Once your umbrella-sampling results are ready, open GROMACS Wizard and follow these steps:
- Switch to the WHAM Analysis tab. Either choose your project path manually or click the auto-fill button (
 ) to load the most recent umbrella-sampling data automatically.
 - Ensure your input folder contains properly numbered subfolders with consistent system and reaction-coordinate definitions.
- Choose the reaction coordinate from the dropdown list that appears.
- Check optional settings like custom bounds, time ranges, or energy units, and adjust if necessary.
- Click Compute to start the analysis.
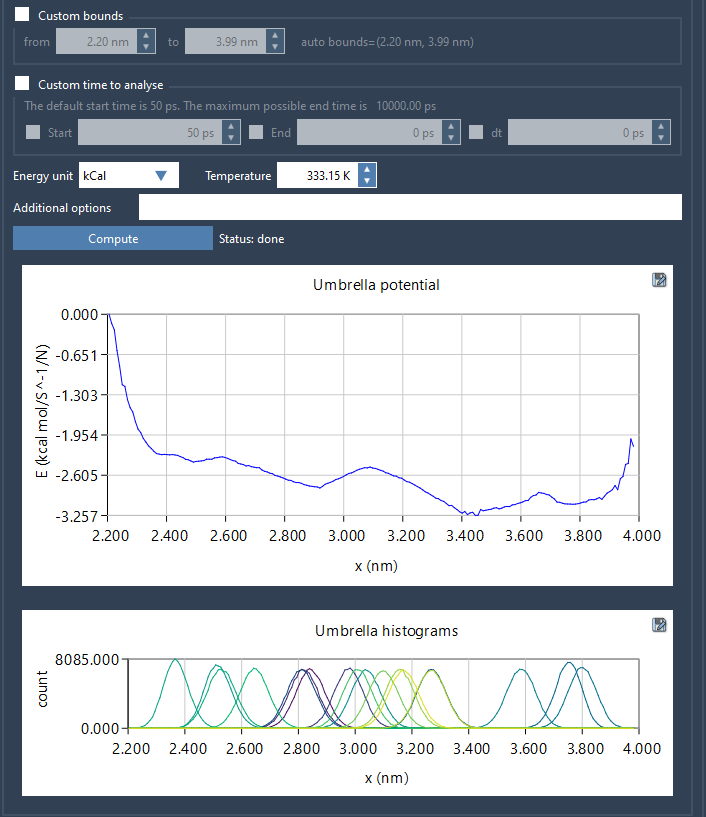
The wizard will extract reaction-coordinate information, time range, and temperature automatically. During computation (which may take minutes for larger datasets), the tool generates two valuable outputs:
- The PMF profile – visualizing the energy landscape
- A histogram – helping track the coverage of the coordinate space
Interpreting Results
The PMF profile gives insight into the energy variations along the reaction coordinate. The accompanying histogram highlights areas where additional data sampling may be needed, helping identify gaps in coverage and prevent inaccurate conclusions.
Upon completion, GROMACS Wizard saves the generated files – including profiles, histograms, and plots – in a dedicated wham_results subfolder within your project directory. Switching between reaction coordinates? The wizard efficiently reuses previously computed data to save time.
Refining Data if Necessary
If the histogram indicates insufficient sampling in certain regions, consider returning to your umbrella-sampling workflow to extend or add simulations for problematic windows. This ensures a more reliable PMF profile and boosts the accuracy of your modeling efforts.
Ready to Explore Further?
Lay the groundwork for high-quality molecular models by integrating GROMACS Wizard into your analysis toolkit. For a deeper dive into setting up and running PMF analysis, visit the original documentation page: https://documentation.samson-connect.net/tutorials/gromacs-wizard/pmf-analysis/.
SAMSON and all SAMSON Extensions are free for non-commercial use. You can get SAMSON from https://www.samson-connect.net.