



Compactness is a key factor to monitor when studying molecular modeling. Whether you are exploring folding, swelling, or large-scale structural changes, keeping track of how tightly your molecules pack together can reveal critical insights. One well-established and efficient way to do so is by analyzing the Radius of Gyration. In this blog post, we explore how SAMSON makes it easy for molecular modelers to add Radius of Gyration plots to their workflow, ensuring they never miss out on important trends in molecular compactness.
What is the Radius of Gyration?
The Radius of Gyration quantifies the overall compactness of a molecular structure or a group of atoms over a specific path or trajectory. It allows researchers to observe how molecules expand, collapse, or reshape over time, which is especially useful when investigating dynamic processes like protein folding, material swelling, or structural deformation. The result is reported in Å. This property provides actionable insights into the stability or flexibility of specific molecular conformations.
How to Add Radius of Gyration Plots in SAMSON
SAMSON’s Path Analyzer module makes monitoring the Radius of Gyration straightforward. Here’s a quick guide to get started:
- Open the Path Analyzer in SAMSON.
- Select Radius of Gyration under the Observable options.
- Choose a Path to analyze.
- Define the Group of atoms you are interested in.
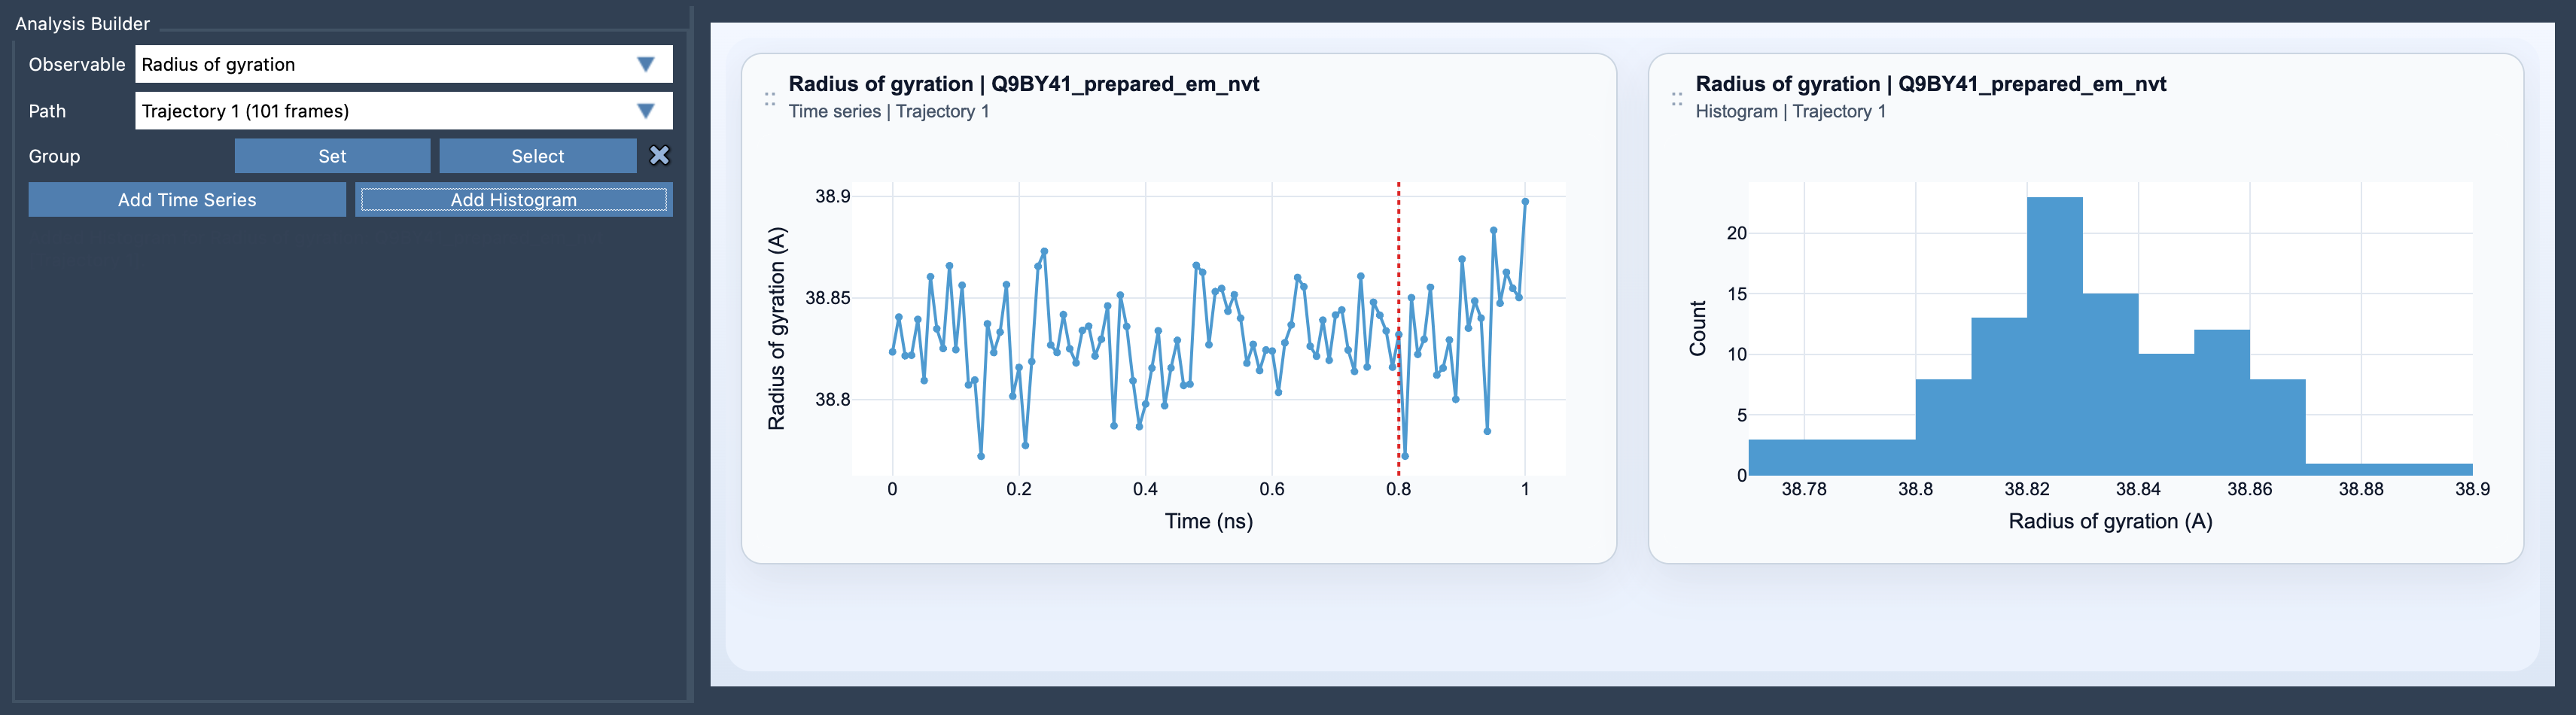
- Click Add Time Series to visualize compactness over time or Add Histogram to inspect the compactness distribution.
The time series visualization allows you to keep track of how compactness evolves along a trajectory, while the histogram provides insights into preferred structural ranges.
Tips for Maximizing the Use of Radius of Gyration
The Radius of Gyration is often a first step toward understanding molecular dynamics. However, for deeper insights, pair it with other complementary tools like:
- Asphericity to explore how symmetric or asymmetric your molecule’s shape is.
- Shape Parameter for detailed information on shape evolution and structural transitions.
These combined measures help you evaluate not only how compact your system is but also how it is changing shape in the process.
Conclusion
Monitoring molecular compactness could be the key to unlocking critical insights into your model. With SAMSON’s Radius of Gyration plot, you gain the ability to easily generate time series or histograms to visualize these changes, making it an essential diagnostic tool for molecular modelers. Ready to streamline your analysis?
Learn more about the Radius of Gyration tool by checking out the full documentation here: https://documentation.samson-connect.net/users/latest/references/path-analyzer/radius-of-gyration/.
SAMSON and all SAMSON Extensions are free for non-commercial use. Download SAMSON at https://www.samson-connect.net.