In molecular simulations, tracking the motion of binding partners, domains, or other parts of a system can quickly become overwhelming. Many molecular modelers manually inspect coordinate files or visualize entire trajectories, making it difficult to focus on the actual motion of interest like the ligand unbinding event or domain displacement.
The Pathlines extension in SAMSON offers a simple and visual solution: it generates a pathline representing the motion of the center-of-mass (COM) of selected atoms along predefined simulation paths. This is particularly useful for highlighting changes in macromolecular conformation or ligand migration.
Why Focus on Center-of-Mass Motion?
The center-of-mass captures the average spatial position of a group of atoms, offering a clear way to trace the motion of flexible domains, ligands, or residues without adding the complexity of detailed structural changes at every frame. It reduces the dimensionality of motion and aids in comparative analysis of different events or simulations.
How to Set It Up
To create a center-of-mass pathline in SAMSON, follow these three key steps:
1. Select Atoms and Paths
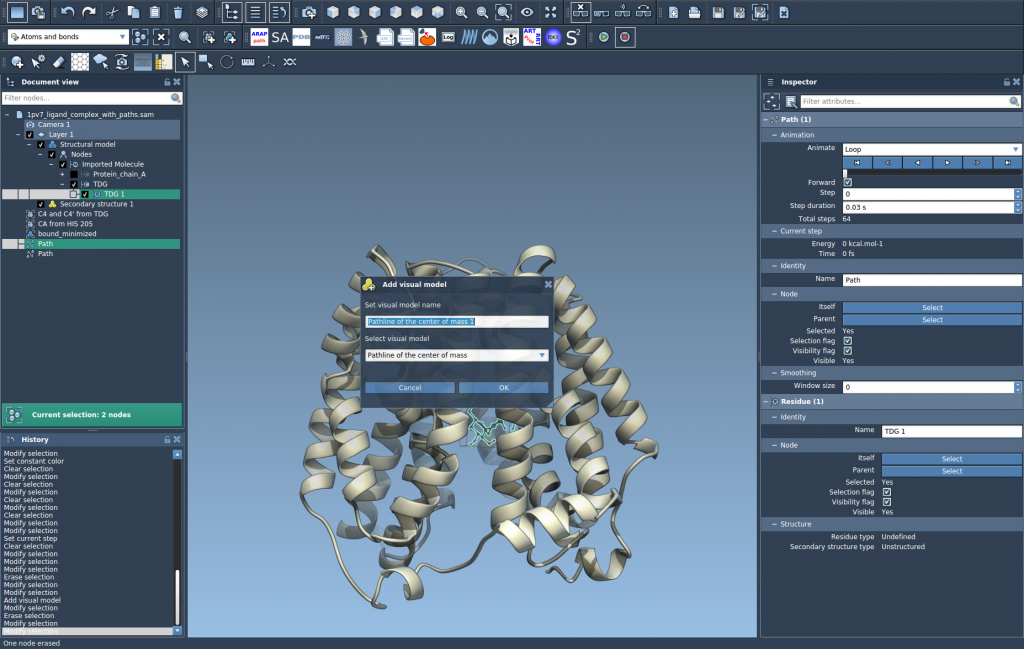
Open the Document view and select the atoms you’re interested in (e.g., a ligand or domain). Then select one or more paths. If no atoms are selected, SAMSON will use the entire system. Similarly, if no path is selected, SAMSON will include all paths in the document.

2. Create a Pathline Visual Model
Go to Visualization > Visual model > More… (or use the shortcut Ctrl/Cmd + Shift + V). In the dialog that appears, select Pathline of the center of mass and click OK.

3. Customize and Inspect
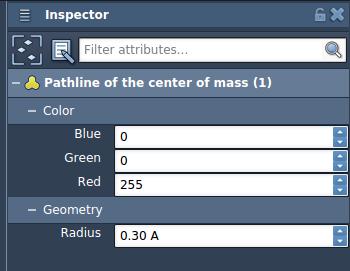
Once created, the pathline visually represents the COM trajectory across the selected path. Use the Inspector to adjust its color and thickness to better highlight trends or distinguish multiple paths.

Practical Benefits
- Simplified Visualization: Focus on the net movement of a group of atoms, avoiding the noise of full atomic detail.
- Comparative Analysis: Overlay pathlines from different simulations to compare ligand unbinding pathways.
- Workflow Integration: Combine with the Ligand Path Finder or P-NEB to optimize and explore new paths.
In just a few clicks, you can move from raw simulation data to a clean and meaningful visualization of motion.
For a complete guide, visit the official documentation page:
https://documentation.samson-connect.net/tutorials/pathlines/pathlines/
SAMSON and all SAMSON Extensions are free for non-commercial use. You can get SAMSON at https://www.samson-connect.net.


