



Refining protein structures is a crucial step in molecular modeling. Biochemists and structural biologists often encounter strained residues in protein models, which can lead to inaccuracies in simulations or downstream applications. If you’ve ever struggled with spotting and fixing problematic conformations, the Interactive Ramachandran Plot in SAMSON can save you time and improve protein accuracy efficiently. Here’s how this tool can be a game-changer for your molecular modeling workflows.
The Challenge of Validating Protein Conformations
Protein structures consist of a backbone with specific dihedral angles, namely φ (phi) and ψ (psi). However, not all configurations of these angles are energetically feasible due to steric clashes or unfavorable interactions. Identifying strained conformations manually can be slow and error-prone, especially for large proteins.
This is where the Ramachandran plot comes in. A Ramachandran plot maps ψ against φ for each residue, highlighting energetically favorable regions (yellow) and disallowed areas (white). The Interactive Ramachandran Plot in SAMSON builds upon this concept, offering a dynamic approach to visualize, validate, and troubleshoot protein conformations directly.
How to Use the Interactive Ramachandran Plot
Here’s a step-by-step guide to inspecting and editing protein backbone conformations with the Interactive Ramachandran Plot:
1. Initiating the Ramachandran Plot App
Open a protein structure in SAMSON, for example, PDB ID 1YRF. Next, launch the Ramachandran Plot app through Home > Apps > Biology > Ramachandran plot.
After starting the app, click Update to visualize the plot. You’ll see dots on a graph corresponding to residues in the protein.
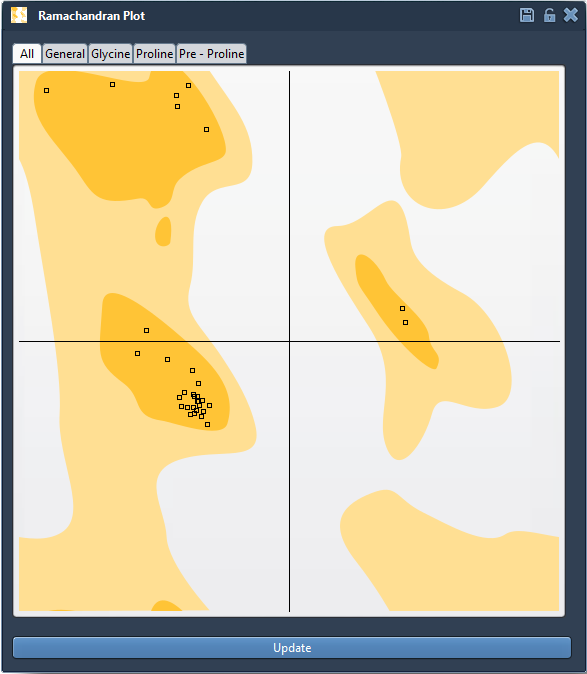
Key regions:
- Yellow areas: Energetically favorable conformations.
- White areas: Unfavorable conformations.
The tabs above the plot allow you to filter residues by type, such as Proline, Glycine, or Pre-proline (residues before proline in the sequence).
2. Exploring Residual Conformations
To refine a specific residue, simply click on its corresponding dot in the plot. For instance, selecting a proline residue will:
- Highlight the residue in the molecular viewport.
- Display its φ and ψ values in the status bar for precise tracking:

With this interactive feedback, you can pinpoint strained regions in seconds.
3. Interactive Editing: Two Approaches
Once residues with unfavorable conformations are identified, you can adjust them using the following features:
Option 1: Drag in the Plot
- Click and drag a dot on the plot. The dihedral angles update in real time, and the protein structure adjusts accordingly in the 3D viewport.
- If adjustments do not yield satisfactory results, revert changes by pressing Ctrl/Cmd + Z.
Option 2: Use the Twister Editor
- Enable the Twister editor
 in the sidebar.
 - Manually twist the protein in 3D space. Changes to φ and ψ are reflected live in the Ramachandran plot.
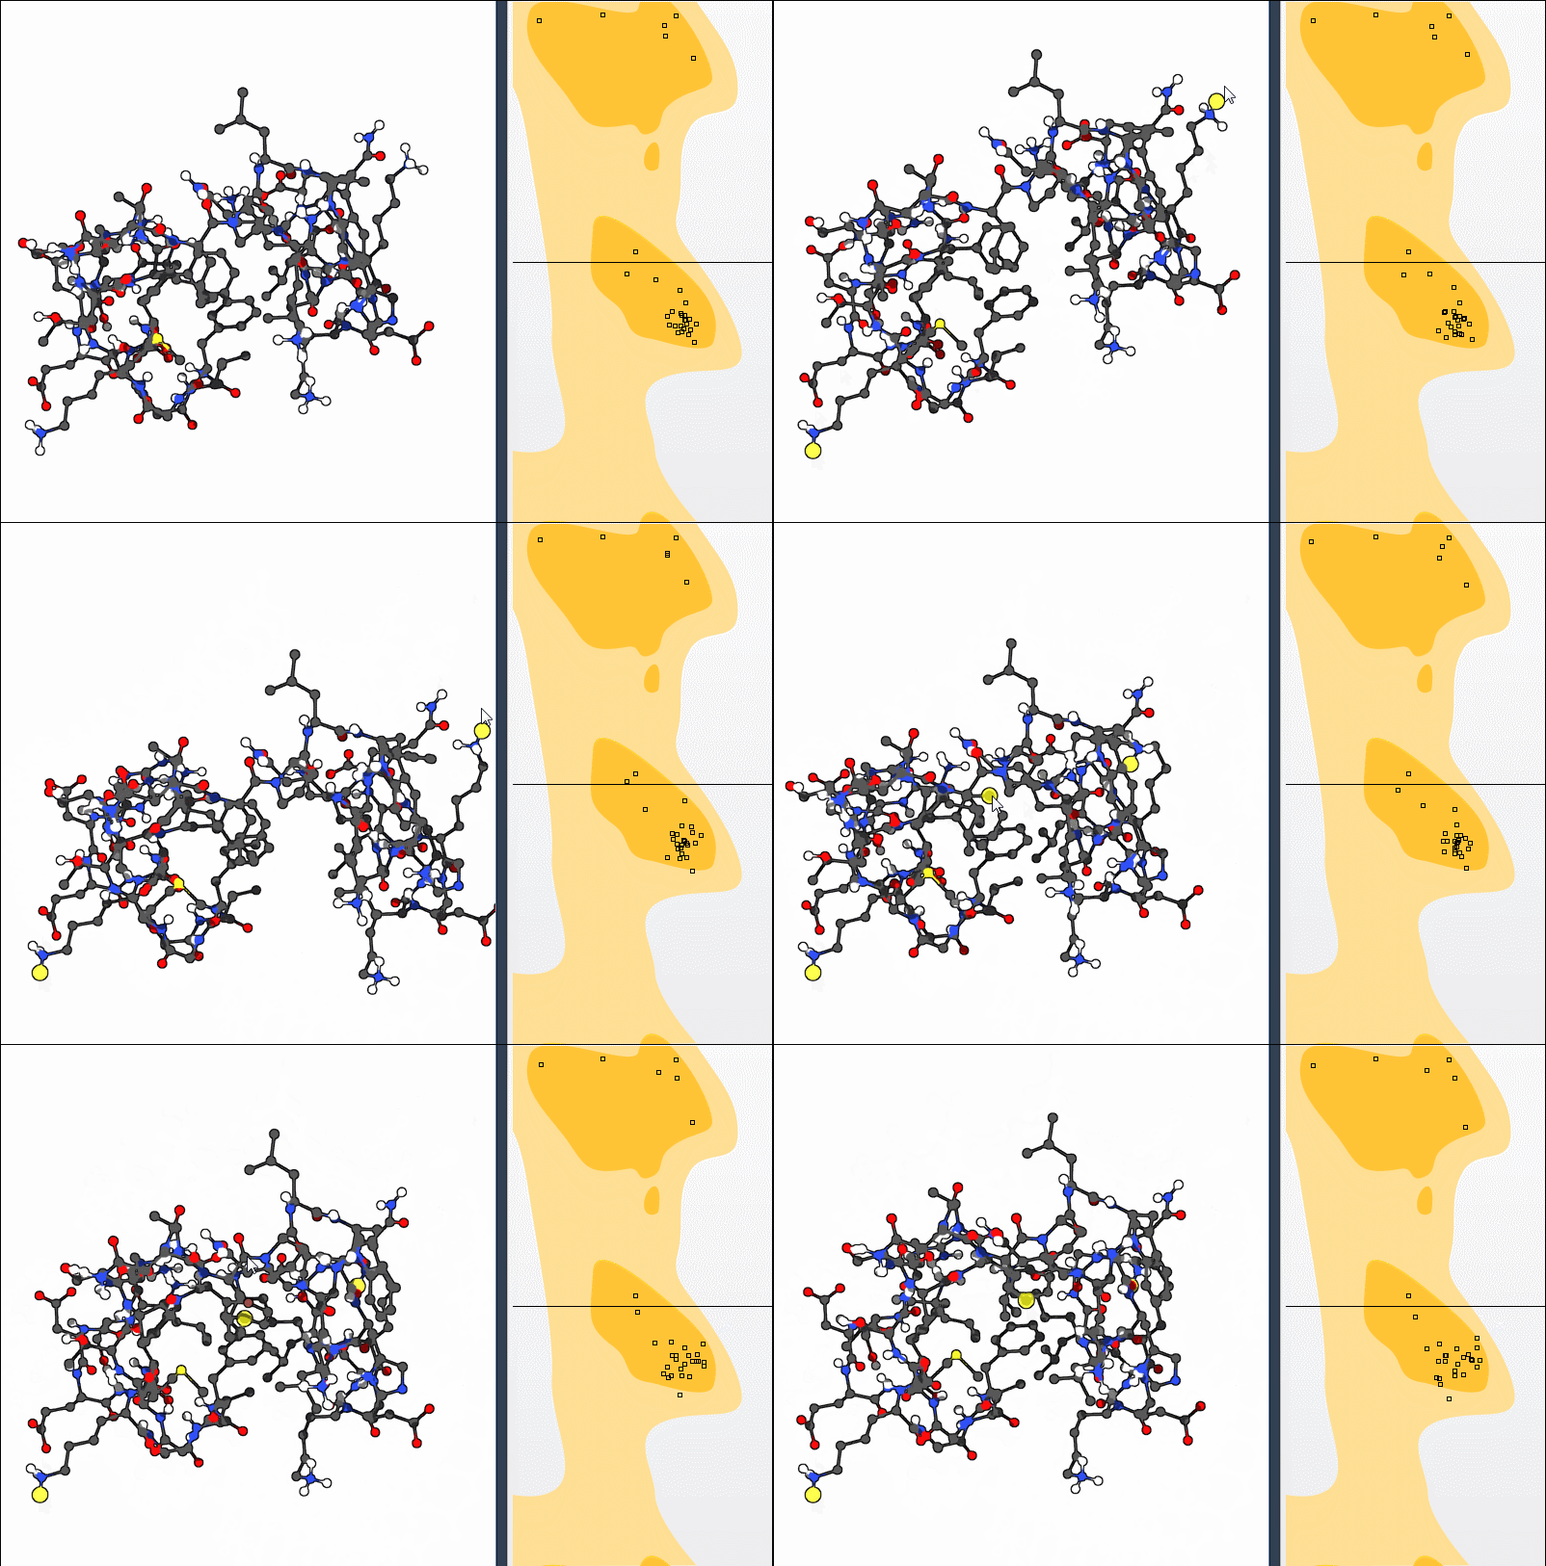
With these tools, resolving strained residues becomes a straightforward task.
Applications and Benefits
Using the Interactive Ramachandran Plot can streamline several modeling and validation steps:
- Detect strained residues: Address issues before simulations begin, avoiding failed runs or inaccuracies.
- Refine homology models: Improve accuracy by fixing outliers from automatically generated models.
- Optimize active sites: Tweak conformational flexibility in regions critical for binding or catalysis.
By integrating global adjustments with local residue refinement, the Interactive Ramachandran Plot empowers modelers with better workflows.
Learn More
Want to dive deeper into leveraging the Interactive Ramachandran Plot? Visit the original documentation page at interactive Ramachandran plot tutorial.
Note: SAMSON and all SAMSON Extensions are free for non-commercial use. You can download your copy at SAMSON Connect.