



Understanding how proteins change their structure over time can be crucial for molecular modeling and design. These transformations often hold key insights into protein functionality, dynamics, and potential interactions with other molecules. For molecular modelers, having a clear, high-level summary of these structural changes can save time and improve focus, especially when monitoring large or complex systems. This is where SAMSON’s Secondary Structure Content analysis comes in, offering a user-friendly way to track the evolution of alpha, beta, and unstructured content across the trajectory of your selected protein path.
Why Analyze Secondary Structure Content?
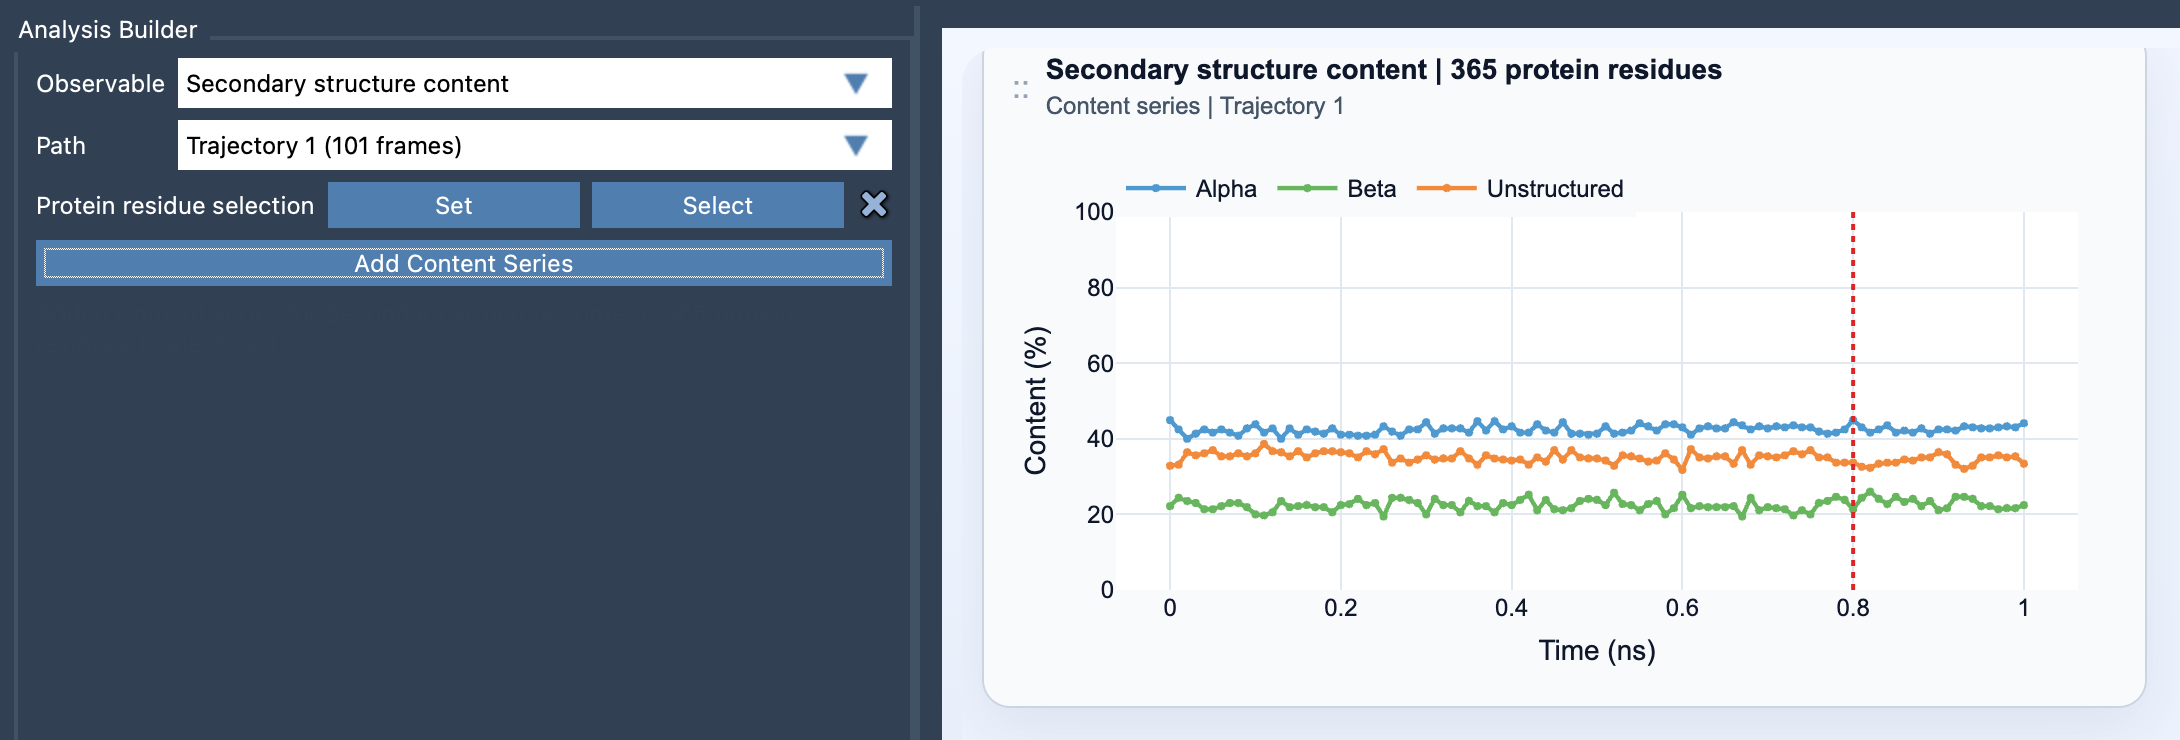
If your goal is to gain a deeper understanding of how a protein’s backbone transitions through different states (e.g., alpha-helix to beta-sheet or to an unstructured form), a high-level summary is a great starting point. Rather than combing through large datasets manually, this analysis highlights trends and transitions clearly and visually, showing precise percentages of protein residues in each mode at every frame.
How to Add a Secondary Structure Content Plot
Adding a Secondary Structure Content plot to your analysis in SAMSON is a straightforward process:
- Open the Path Analyzer.
- In the Observable menu, select Secondary Structure Content.
- Choose a Path that contains the frames you’re interested in tracking.
- Select the protein residues (or subset) you want to analyze.
- Click Add Content Series, and the plot will be generated.
What You Get
The result is a multi-series time plot that reveals the percentages of residues in alpha, beta, and unstructured states, updated for each frame over your trajectory. Here’s what makes it particularly useful:
- Visual clarity: You get an intuitive time plot scaled between 0 and 100% so that you can immediately grasp overall trends.
- Customizability: By selecting specific subsets of your protein, such as domains, helix bundles, or loop-rich regions, you can zoom in on the elements most relevant to your research.
Tips for Getting the Most Insight
Here are some practical tips to maximize the insight you gain from secondary structure content analysis:
- For a global view, use broad residue selections. This is excellent for determining overall protein stability or dynamics.
- For a more targeted analysis, focus on specific areas such as a single domain or region of interest.
- Combine this analysis with other tools like the Ramachandran plot in SAMSON for more detailed backbone insights.
If you’re working on designing a protein, analyzing mutations, or exploring protein-ligand interactions, this tool simplifies the process, letting you focus on interpreting results instead of manually calculating transitions.
By using the Secondary Structure Content tool in SAMSON’s Path Analyzer, molecular modelers of all levels can efficiently quantify and visualize changes, providing invaluable insights into your research. To learn more, please visit the official documentation page: https://documentation.samson-connect.net/users/latest/references/path-analyzer/secondary-structure-content/.
SAMSON and all SAMSON Extensions are free for non-commercial use. Get SAMSON at https://www.samson-connect.net.