


For many molecular modelers, understanding and refining protein backbone conformations is a fundamental step in structure optimization, error detection, and simulation preparation. However, pinning down these conformations in a seamless and interactive way has often been a complex endeavor. If you are looking for a tool that simplifies this process, the Interactive Ramachandran Plot in SAMSON might be exactly what you need.
Why the Ramachandran Plot Matters
The Ramachandran plot is a staple tool in structural biology that illustrates energetically allowed regions for backbone dihedral angles (φ and ψ) of amino acid residues. It visually depicts favored regions (typically shown in yellow) and disallowed conformations (white areas) based on steric and energetic constraints. This makes it an invaluable tool for detecting issues like strained residues and understanding protein flexibility.
In SAMSON, the Interactive Ramachandran Plot takes this traditional visualization to the next level by allowing you not only to analyze but also to directly edit your protein conformations, making the exploration process much more dynamic and practical.
Getting Started with the Interactive Ramachandran Plot
If you’re ready to streamline your protein-modeling workflow, here’s how to get started:
- Log into your SAMSON Connect account.
- Visit the Interactive Ramachandran Plot Extension page and click Add.
- Restart SAMSON to activate the extension.
Once installed, you can load any protein structure, such as PDB ID 1YRF, to begin visualizing its Ramachandran plot:
- Go to Home > Fetch in SAMSON.
- Input
1YRFunder PDB or PDB (mmCIF), and click the Load button.
Visualizing and Exploring Residues
After opening the Ramachandran Plot app (via Home > Apps > Biology > Ramachandran plot), click Update to generate your plot:
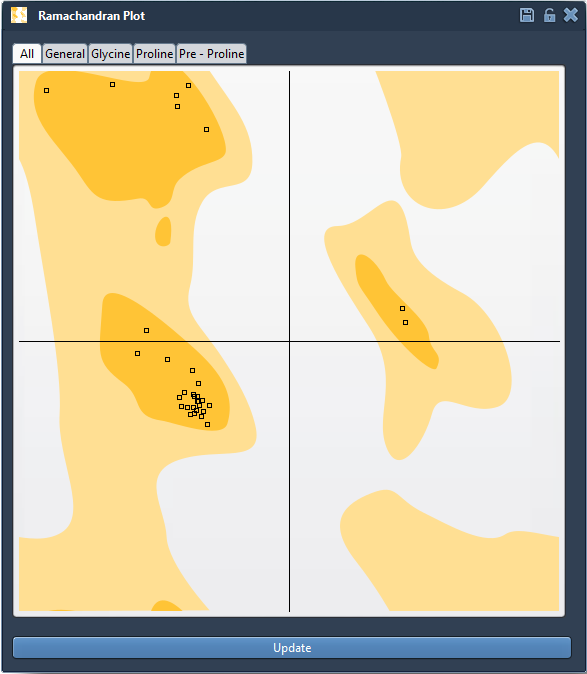
The generated plot categorizes residues into several tabs, such as General, Glycine, and Proline. Click on a dot representing a residue to instantly visualize it within the 3D protein structure. This feature is useful for inspecting specific areas, such as key active sites or strained regions.
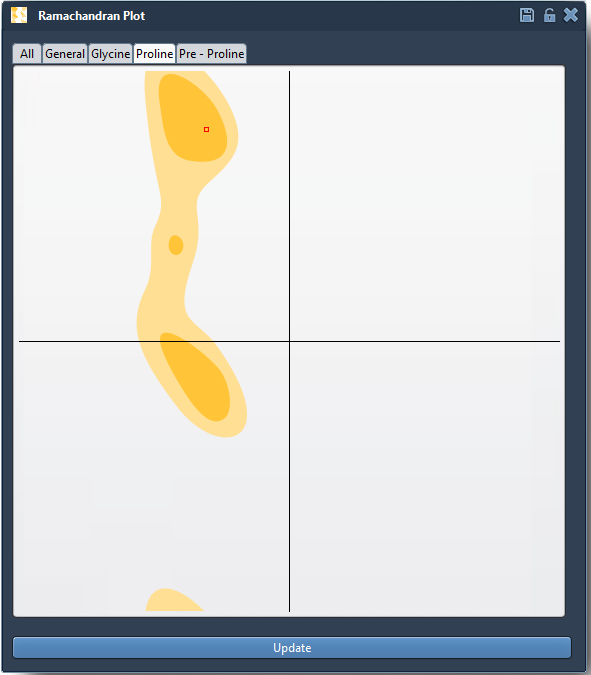
When a residue is selected, the status bar in SAMSON displays its φ and ψ dihedral angle values:

Interactive Editing: Update Structures in Real Time
The Interactive Ramachandran Plot is more than a visualization tool—it also enables real-time conformational editing. There are two ways to fine-tune residues directly from the plot:
Option 1: Drag Points in the Plot
- Simply drag a point in the Ramachandran plot to adjust the φ and ψ angles of a residue.
- The corresponding 3D structure updates instantly so that you can immediately see the results of your adjustments.
- If you make a mistake, press Ctrl/Cmd + Z to undo your action.
Option 2: Use the Twister Editor
- Select the Twister Editor from the left-hand menu within the 3D viewport.
- Twist and manipulate specific residues or regions of the protein in 3D, while observing how the Ramachandran plot changes in real time:
Applications in Protein Modeling
The ability to validate and adjust conformations directly from the Ramachandran plot has important applications, including:
- Detecting and addressing strained residues prior to simulation.
- Refining models produced via homology modeling by correcting outliers.
- Exploring flexibility in active or binding sites to understand molecular interactions.
Learn More
These features combine to make the Interactive Ramachandran Plot an indispensable part of the molecular modeling toolkit. For more detailed instructions and advanced functionality, visit the full documentation page at https://documentation.samson-connect.net/tutorials/ramachandran/ramachandran-plot/.
Note: SAMSON and all SAMSON Extensions are free for non-commercial use. Get started today at https://www.samson-connect.net.