


For molecular modelers, understanding and fine-tuning protein structures is essential, especially when working on simulations or refining homology models. Yet, identifying strained residues or understanding backbone conformations can be a challenging task. This is where the Interactive Ramachandran Plot in SAMSON shines, serving as a reliable and efficient tool to dive deeper into individual residues and their conformational data. In this post, we'll walk through how to explore protein residues with the Ramachandran Plot App and make your protein-modeling workflows smoother.
Why Explore Individual Residues?
When working with proteins, each residue plays a role in the overall stability and activity of the structure. Strained or disallowed conformations can impact predictions, introduce energy penalties, or compromise the integrity of your model. By zooming in on the dihedral angles φ (phi) and ψ (psi) of specific residues, one can efficiently diagnose and amend potential issues.
How to Get Started
The Interactive Ramachandran Plot app provides an intuitive way to explore residues directly on a Ramachandran plot. Here is how it's done:
- Open a protein structure (for example, use PDB ID
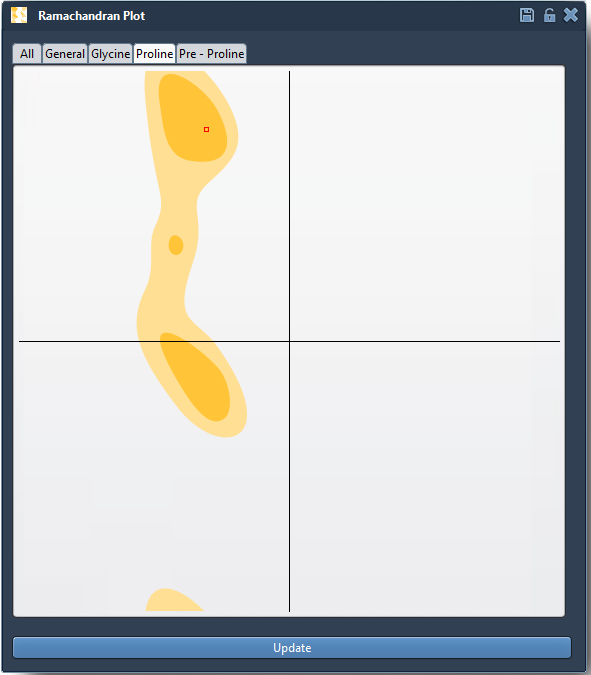
1YRF). - Navigate to the Ramachandran Plot app via Home > Apps > Biology > Ramachandran plot. Once the app is open, click Update to generate the plot.
A colored plot will now appear, with yellow areas representing energetically favorable regions and white areas indicating disallowed conformations. This provides an immediate overview of which residues in your protein might need attention.
Exploring Individual Residues
To deeply investigate a specific residue:
- Click on any dot within the plot (each corresponds to a residue).
- Upon selection, the residue is highlighted in the 3D viewport, enabling you to visually examine its position and environment within the protein structure.
For example, selecting a proline residue displays both its location in the 3D model and its dihedral angles φ and ψ in the status bar:
This powerful feedback loop lets you correlate Ramachandran characteristics (like outlier regions) with the protein's 3D structure.
Practical Applications
Some typical use cases include:
- Identifying residue outliers that may destabilize a protein.
- Exploring residues in active binding pockets to ensure conformational flexibility.
- Validating homology models to refine regions not in energetically favorable conformations.
Why is This Tool Useful?
This method not only improves precision in detecting outliers but also integrates seamlessly into broader workflows in protein modeling, including energy minimization, refinement, and mutation studies. It empowers researchers to navigate conformations directly and make informed choices to improve their models.
Learn More
The Interactive Ramachandran Plot in SAMSON is a must-have tool for streamlining protein modeling tasks and improving structural insights. To explore more features and capabilities, visit the full documentation at https://documentation.samson-connect.net/tutorials/ramachandran/ramachandran-plot/.
SAMSON and all SAMSON Extensions are free for non-commercial use. You can download SAMSON at https://www.samson-connect.net.