


Molecular modelers often deal with the complexity of tracking secondary structure changes in proteins over time. Whether you are studying dynamics, structural transitions, or ligand interactions, visualizing how much of your protein is in alpha-helix, beta-sheet, or unstructured conformations can be invaluable. The Secondary Structure Content tool in SAMSON’s Path Analyzer is designed precisely for this purpose, giving you an insightful overview at each frame of your simulation or analysis.
Understand Your Protein’s Backbone States
The Secondary Structure Content tool allows you to analyze how the backbone state of your protein evolves over time. It breaks down the conformations into percentages of alpha-helices, beta-sheets, and unstructured regions. This high-level summary is particularly useful for:
- Tracking folding and unfolding events.
- Examining domain-specific structural changes.
- Identifying transitions or stability in molecular dynamics simulations.
Whether you are focusing on a single loop or the entire protein, the visualization provided by this feature is incredibly versatile and easy to read.
How to Get Started
Adding the Secondary Structure Content plot to your analysis is straightforward. Here’s how you do it:
- Open the Path Analyzer in SAMSON.
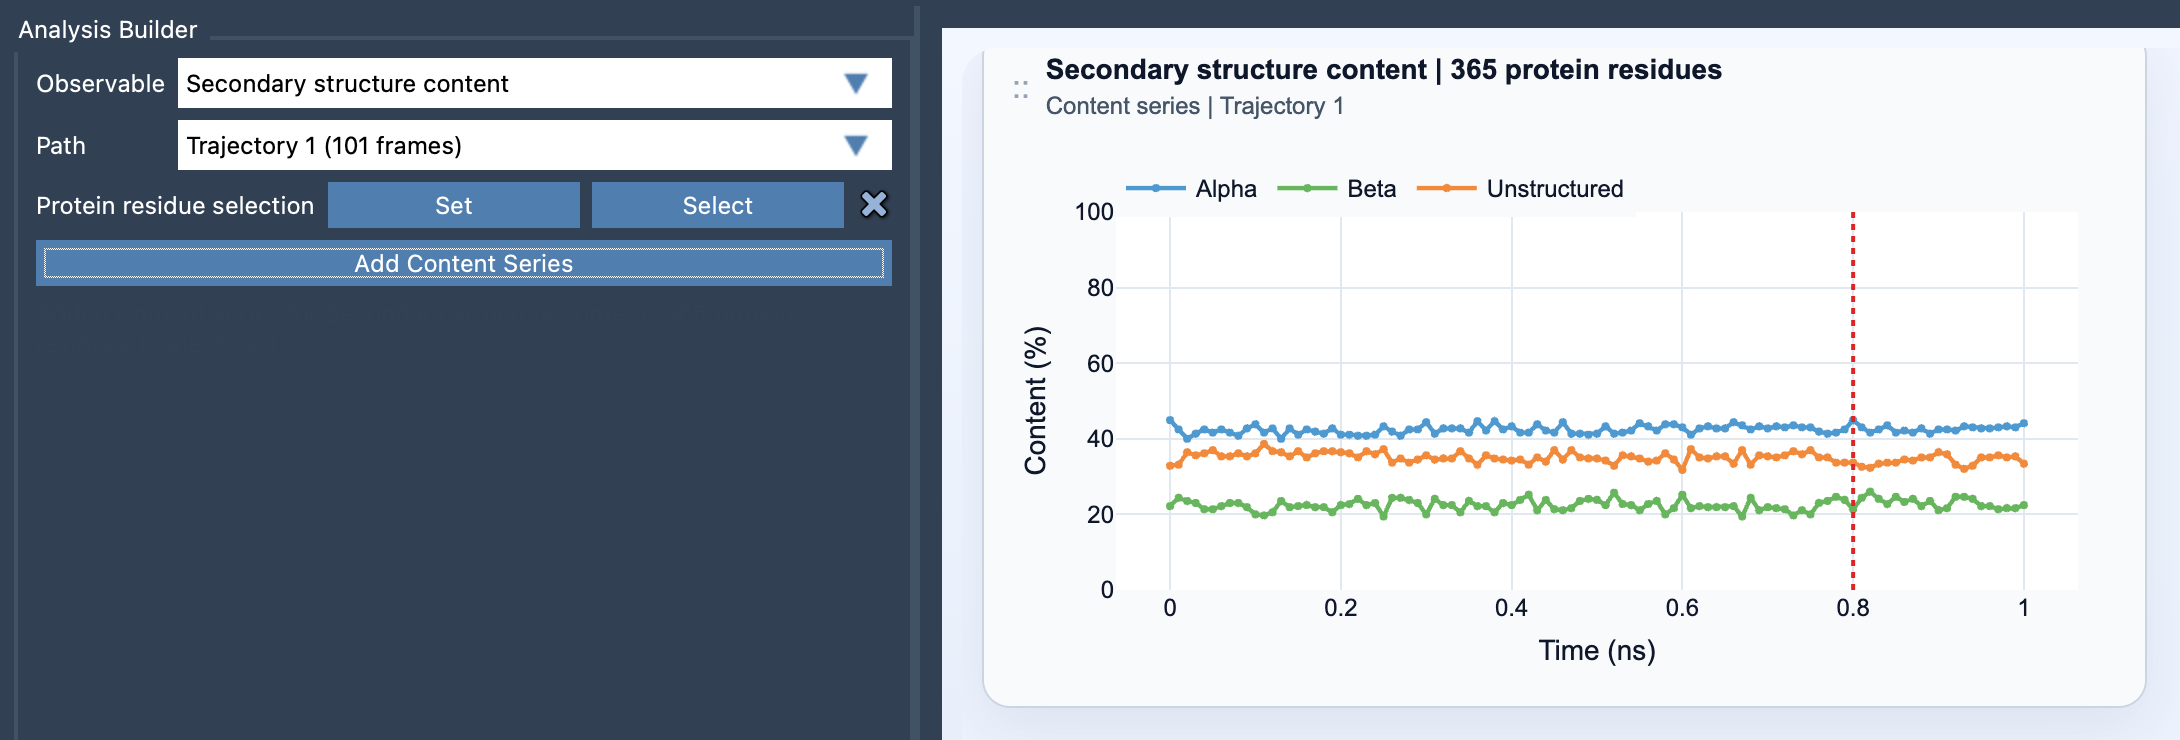
- In the Observable dropdown menu, select Secondary Structure Content.
- Choose a protein Path you have defined.
- Specify your Protein residue selection – this can be the entire protein or specific domains like loops or helices.
- Click on Add Content Series to generate the plot.
You will now have a detailed and dynamic percentage breakdown of your protein’s secondary structures, frame by frame.
View the Results
The output is a clean, time-based multi-series plot, where the Y-axis shows the percentage of each backbone state (0 to 100%) and the X-axis spans your timeline. This enables you to instantly identify any fluctuations or trends in secondary structure conformation.
Try experimenting with broad selections for a protein-wide view or more focused selections for localized insights, depending on your research question.
Use Cases and Tips
- Monitor stability during molecular dynamics simulations or under varied conditions like temperature changes.
- Isolate and analyze structural behavior for specific domains or motifs (e.g., a helix-rich bundle or flexible loops).
- Pair it with Ramachandran analysis to examine both high-level trends and residue-level insights.
Whether you are validating computational predictions, exploring folding pathways, or characterizing structural anomalies, this feature is a powerful addition to your analysis workflow.
Learn More
For a detailed step-by-step explanation of this feature and its applications, visit the official SAMSON documentation at this link. Explore how you can leverage this tool to simplify protein analysis and improve your molecular design.
Note: SAMSON and all SAMSON Extensions are free for non-commercial use. You can get SAMSON at https://www.samson-connect.net.