


Protein modelers often face a common challenge: ensuring that their protein backbone conformations are energetically favorable and correct before moving on to simulations or docking. Strained or disallowed conformations can lead to inaccurate results and inefficient workflows. The Interactive Ramachandran Plot in SAMSON offers a practical solution by letting users visualize and refine the φ (phi) and ψ (psi) dihedral angles of amino acid residues interactively.
What Makes the Ramachandran Plot Essential?
The Ramachandran plot provides insight into the energetically allowed regions of backbone dihedral angles. Yellow-shaded areas represent favorable conformations, while white areas indicate unfavorable ones. By using such a visual representation, researchers can detect problematic residues and optimize their 3D structures for better performance in modeling tasks.
Here’s what makes the interactive tool a game-changer: it provides real-time feedback. You can directly select, modify, and refine residues while observing updates to the structural visualization and the plot itself.
Steps to Visualize and Optimize a Protein
Step 1: Loading Your Protein Structure
To get started, load the protein structure you’d like to work on. For example, you can use a structure like PDB ID 1YRF:
- Navigate to Home > Fetch in SAMSON.
- Enter
1YRFin the PDB or PDB (mmCIF) field. - Click the Load button to bring the structure into the workspace.
Step 2: Accessing the Ramachandran Plot App
Next, open the Interactive Ramachandran Plot app via Home > Apps > Biology > Ramachandran plot:
![]() Click the Update button to generate a plot visualizing the φ and ψ angles of all residues.
Click the Update button to generate a plot visualizing the φ and ψ angles of all residues.
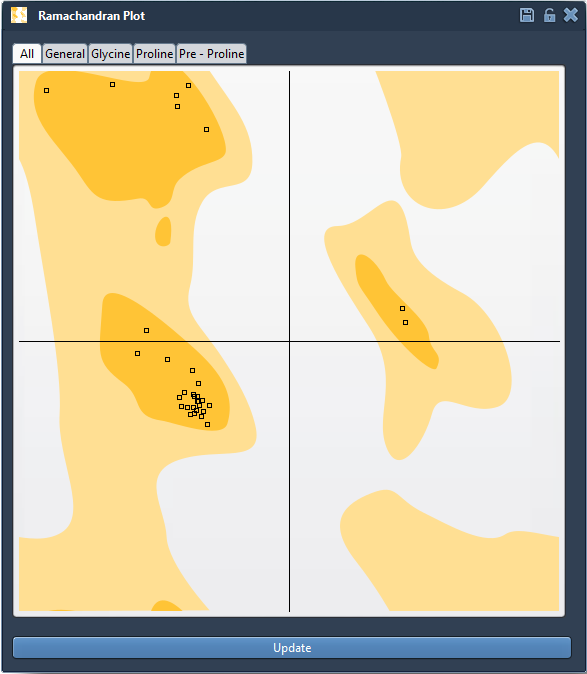
- Yellow areas: Favorable conformations.
- White areas: Energetically unlikely conformations.
The plot is further categorized into tabs for easy filtering: All, General, Glycine, Proline, and Pre-proline (residues located before a proline). Such categorization helps in targeted inspection and refinement.
Step 3: Fine-Tuning Backbone Conformations
The Ramachandran Plot app allows two powerful interactive options for editing:
Option 1: Dragging Points in the Plot
- Click and drag any residue dot within the plot to instantly visualize changes to its φ and ψ angles.
- The corresponding 3D structure will update in real time, providing immediate feedback for better decision-making.
- Undo any modification quickly using Ctrl/Cmd + Z.
Option 2: Using the Twister Editor
For those who prefer working directly in 3D space, the Twister Editor provides an alternative:
- Select the Twister editor
 from the left-hand menu.
 - Twist the protein in the viewport to adjust dihedral angles, with live updates to the plot.
Applications in Protein Modeling
The Interactive Ramachandran Plot is especially useful for:
- Detecting and resolving strained residues before simulation.
- Refining homology models by addressing outliers in the plot.
- Understanding conformational flexibility in binding or active sites.
Conclusion
Whether you’re preparing a protein for simulation or fine-tuning homology models, the Interactive Ramachandran Plot empowers you with the tools for conformation validation and refinement. By leveraging real-time editing and visualization capabilities, you can ensure your structures are optimized for the next stages of your workflow. To explore this functionality in detail, visit the original documentation page.
SAMSON and all SAMSON Extensions are free for non-commercial use. Download SAMSON at https://www.samson-connect.net.