



Molecular modeling often involves understanding intricate atomic movements in biomolecules, such as ligand unbinding, domain movements, or diffusion pathways. A common challenge for molecular modelers is analyzing and visualizing the center-of-mass (COM) motion of atoms across complex systems. SAMSON’s Pathlines visual model offers a practical and efficient way to address this issue by enabling you to track trajectories of selected atoms along predefined paths within your simulation.
What Are Pathlines?
Pathlines are a visual representation of the COM trajectory of selected atoms as they move along paths. Pathlines can offer insights into ligand unbinding or rebinding routes, conformational changes in macromolecules, or simply track overall molecular motion. This tool is particularly useful when working with intricate simulation data like unbinding pathways or diffusion processes.
Below, we’ll outline how to work with this feature in SAMSON, step-by-step, and show you how to create meaningful insights from molecular simulation data.
Step 1: Load the Sample System
If you’re new to the Pathlines extension, working with a sample system is the best way to familiarize yourself with its functionality. To get started:
- Download the sample file from the SAMSON Connect link: Sample system.
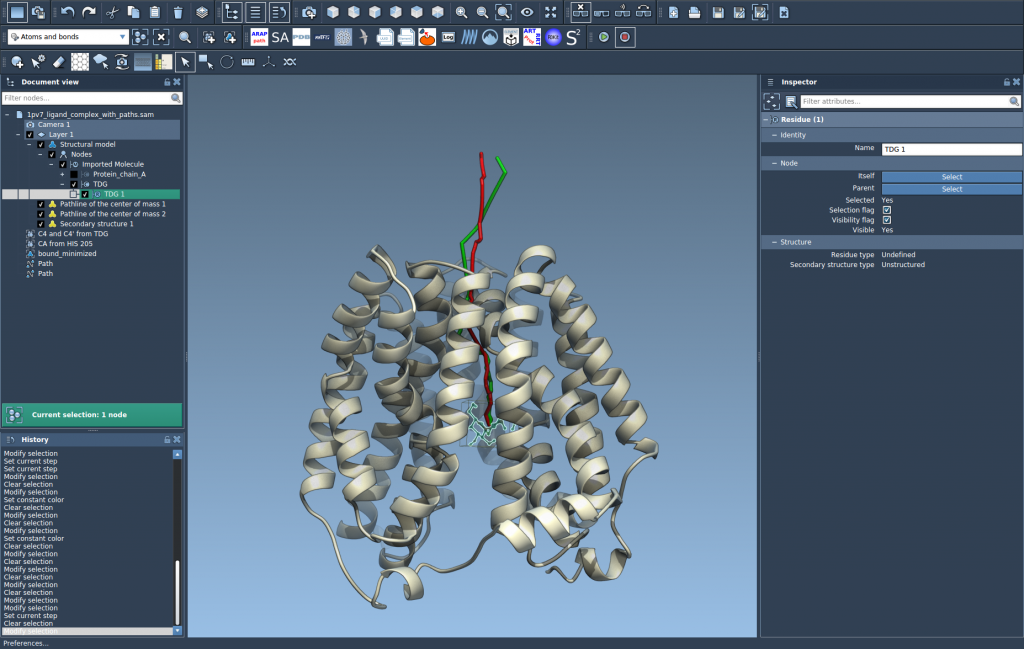
- Open the downloaded system in SAMSON. This document contains a structural model of Lactose permease (
1PV7) with its ligand Thiodigalactosid (TDG), as well as predefined unbinding paths generated using the Ligand Path Finder tool.

Step 2: Select Atoms and Paths
Once the sample system is loaded, the next step is to select the desired group of atoms and paths:
- Go to the Document view and select a group of atoms whose motion you want to track (e.g., a ligand). Hold Ctrl (or Cmd on Mac) to select multiple nodes if necessary.
- Select one or more paths along which you want to visualize the COM motion.
If no atoms are selected, the entire system is used by default. Similarly, if no paths are selected, Pathlines will consider all paths in the document.

Step 3: Create the Pathline Visual Model
With your selection ready, you can now generate a visual representation of the COM motion:
- Go to Visualization > Visual model > More… or use the shortcut (Ctrl/Cmd + Shift + V).
- In the dialog box, choose Pathline of the center of mass and click OK.
And voila! SAMSON generates a sleek visual model that traces the motion of your selected atoms along the chosen path(s):
Step 4: Explore and Customize
Once you’ve created the pathline, try exploring and customizing its properties to gain deeper insights into the molecular system:
- Double-click on a path to start or stop simulation playback.
- Right-click a path for additional context menu options under Path > ….
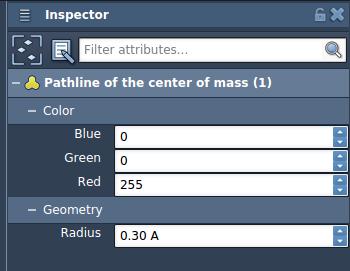
- Adjust the pathline’s visual attributes (e.g., color, thickness) by accessing it in the Inspector window (shortcut: Ctrl/Cmd + 2).
When to Use Pathlines?
The Pathlines visual model is a versatile tool for many applications. Here are just a few examples:
- Display ligand unbinding or rebinding routes.
- Analyze collective domain motions in macromolecular systems.
- Visualize center-of-mass displacement in reaction coordinate workflows.
By utilizing Pathlines, you can enhance your understanding of molecular systems, bringing clarity to complex atomic motion data.
For more in-depth explanations and step-by-step guidance, visit the full documentation page at https://documentation.samson-connect.net/tutorials/pathlines/pathlines/.
Note: SAMSON and all SAMSON Extensions are free for non-commercial use. You can get SAMSON at https://www.samson-connect.net.