



A molecular structure can contain the answer to a design question—and still be difficult to explain. In a 3D view, the ligand, nearby residues, solvent, and contact geometry compete for attention. A useful interaction diagram can make those relationships easier to inspect, discuss, and share, without replacing the 3D structure.
SAMSON’s Interaction Designer connects those two views: it creates a 2D diagram from a molecular selection or the whole document, while keeping the diagram synchronized with the 3D viewport. Here’s a practical way to use that connection to turn a busy binding site into a clearer working view.
Start with the question, not the whole structure
Before generating a diagram, decide what you want to examine: a particular ligand, a selected complex, or the broader document. Select the relevant structures or atoms in the 3D viewport, then choose Home > Diagram. If nothing is selected, the command uses the whole document.
This small choice can make the result easier to read. Starting from a focused selection helps keep the diagram centered on the part of the structure you want to discuss. You can still use the 3D viewport to select structures and atoms in the diagram; double-clicking a structure or atom zooms to it in 3D.

Read contacts as geometric evidence
The diagram can show a binding pocket, ligand solvent accessibility, and interacting residues or structural groups. Supported contact categories include hydrogen bonds, ionic interactions, metal coordination, aromatic contacts, steric clashes, and several atom-to-aromatic-plane and group interactions.
One important distinction helps prevent overinterpretation: a detected contact means that the atoms or groups meet the implemented category and geometric criteria. For example, a hydrogen bond uses donor/acceptor categories and a distance criterion, with an angle criterion when explicit hydrogens are present. Detection does not establish that a contact is stabilizing or calculate its interaction energy. Treat the diagram as a way to inspect candidate geometric relationships—not as a binding-energy result.
Water may appear as participant metadata when it is involved in a contact, but the current implementation does not create a separate water-specific interaction type. Keeping these details in mind makes it easier to describe what the picture shows accurately.
Make the diagram serve the conversation
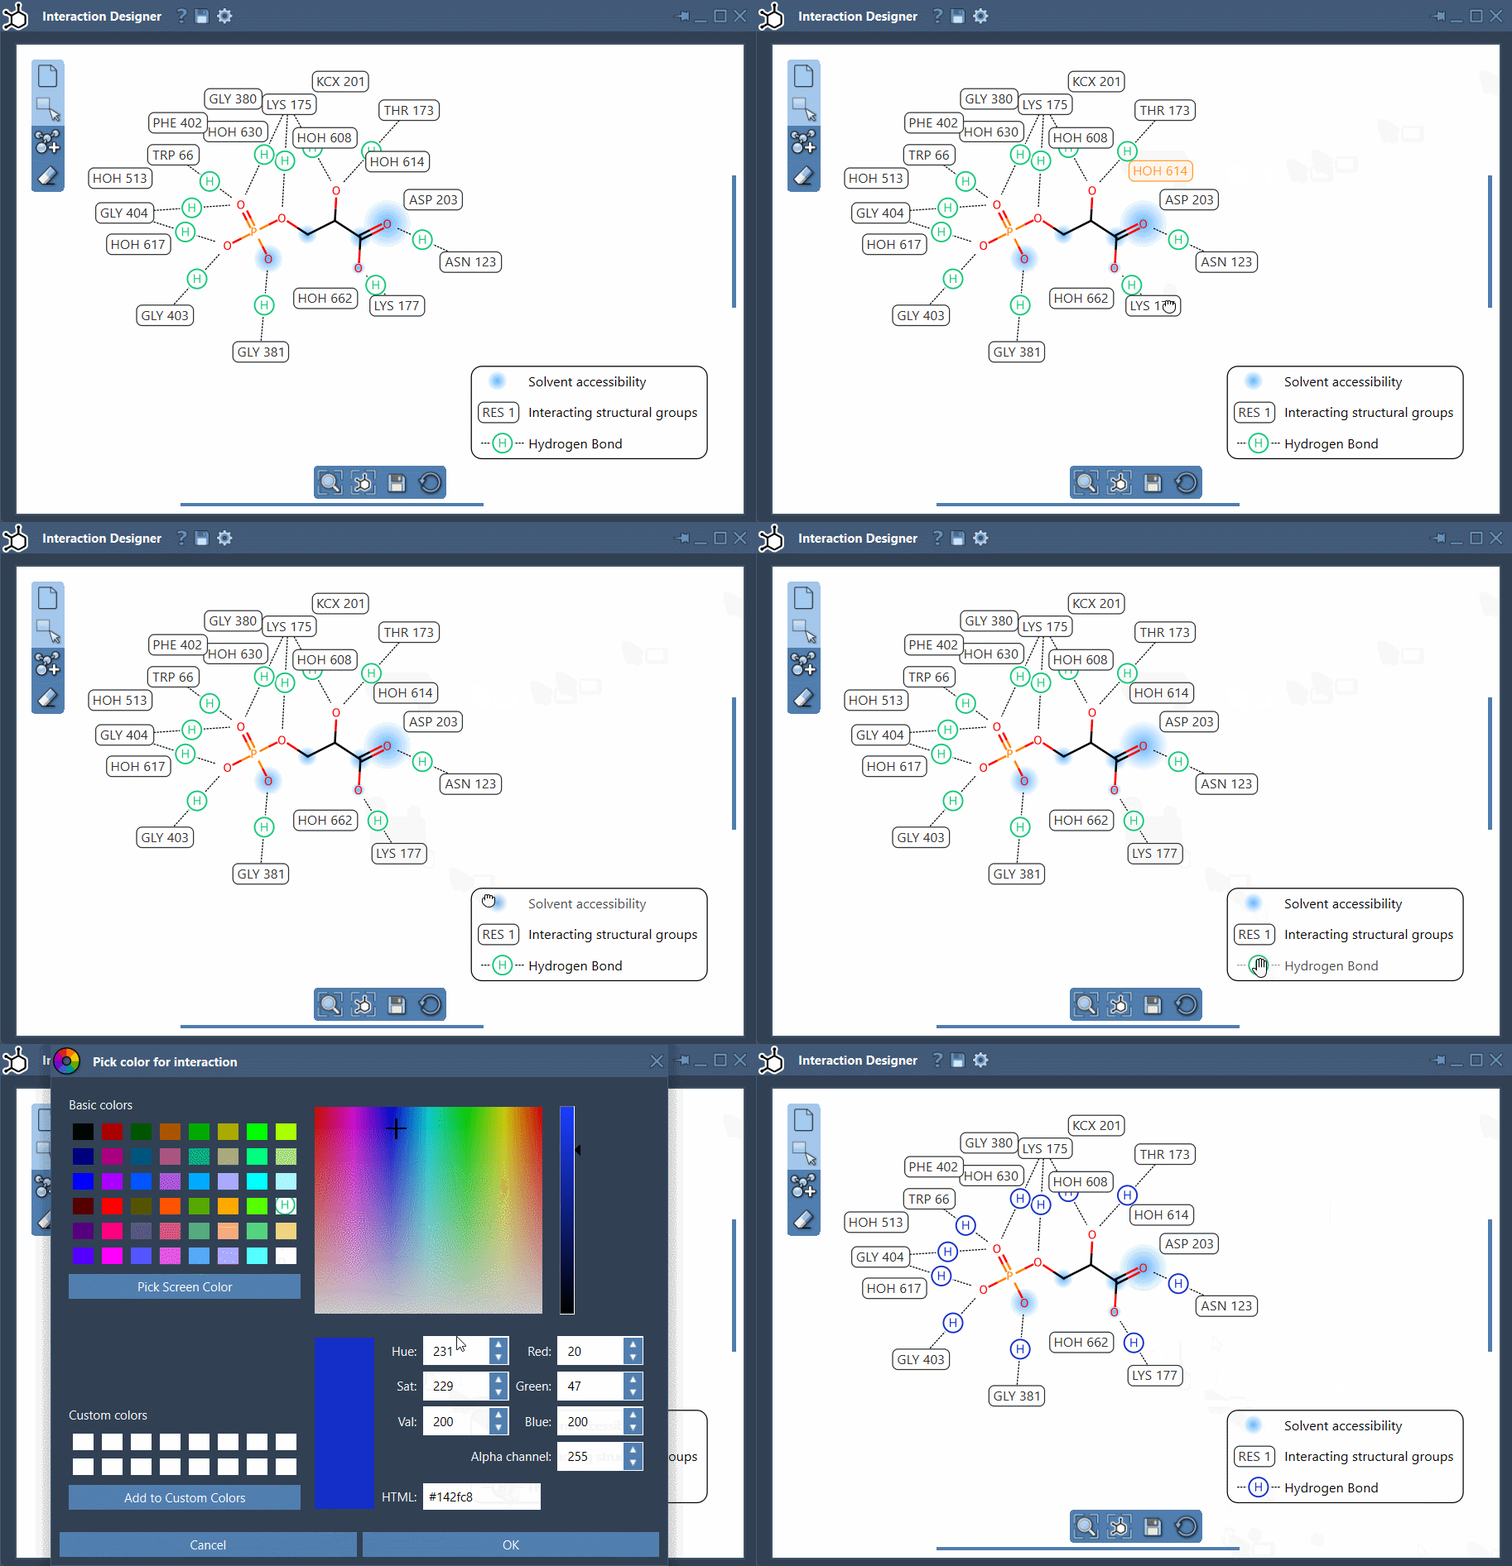
An automatically generated layout is a starting point, not a final figure. Move labels and interaction symbols to reduce overlap or guide the reader’s eye. The caption or legend can be repositioned too. If one contact category is distracting, click its name or icon in the legend to hide or show it. Double-click a category there to change its color; the Interaction Designer settings provide a way to restore colors.
These edits are useful for more than presentation. Hiding a category temporarily can help you focus on a subset of contacts, while moving a label can make it easier to connect the 2D diagram to a residue in the 3D view. Use the bottom menu to update the view and align the 2D and 3D views. To zoom, hold Ctrl (or Cmd on macOS) while scrolling; to translate the diagram, hold the middle or right mouse button while moving the mouse.
Keep design changes connected to 3D
The Interaction Designer can also be used to draw molecules in 2D. Choose Edit > Design to start a new sketch—from scratch, from a molecule in the active document, or from the current selection. In the left panel, choose Add, then click in the designer to place an atom. To extend the molecule, click the atom to which the next atom should connect.
You can choose elements or fragments through the Asset Browser. For common H, C, N, and O atoms, buttons are available at the bottom of the browser; other elements can be selected from the periodic table. Choose a fragment in the browser to build with it, and hold Ctrl or Cmd while choosing a fragment atom to change its pivot. To remove atoms, choose Erase and click the atoms to delete.
Because the 2D document stays synchronized with the 3D viewport, selecting, adding, and removing atoms and fragments is reflected in both views. This makes the sketch useful as part of a connected modeling workflow rather than an isolated drawing. When the diagram or sketch is ready to share, use Save in the bottom panel to export it as PNG, JPG, JPEG, BMP, or SVG.
For a more reliable interpretation, pair a readable layout with a precise description of what was detected—and what the geometry alone cannot tell you. Read the Interaction Designer documentation for the full workflow and supported contact categories.
Note: SAMSON and all SAMSON Extensions are free for non-commercial use. Get SAMSON.