



For molecular modelers focusing on free energy calculations, constructing a Potential of Mean Force (PMF) profile is often a critical step in understanding the energetics underlying molecular interactions. Yet, the process can feel daunting, especially if you’re transitioning from umbrella sampling data analysis to a comprehensive PMF calculation. Fortunately, the GROMACS Wizard in SAMSON streamlines this process using the Weighted Histogram Analysis Method (WHAM). Here, we break down how you can confidently compute PMF profiles after completing an umbrella sampling workflow.
Why PMF Profiles Are Essential
A PMF profile represents the free energy landscape along a reaction coordinate, offering insights into molecular interactions, binding affinities, or conformational preferences. For example, you might use it to investigate pathways for ligand binding or the stability of biological systems under different conditions. However, generating PMF profiles usually involves tedious data processing. GROMACS Wizard simplifies this process by fully integrating WHAM into its interface.
How to Compute the PMF in GROMACS Wizard
Once you’ve run an umbrella sampling simulation, you can follow these simple steps in GROMACS Wizard to generate your PMF profile:
- Switch to the WHAM Analysis Tab: Open the GROMACS Wizard and navigate to the WHAM Analysis tab. This is where the main PMF computation takes place.
- Select Your Project Path: Use the auto-fill function (
 ), which automatically retrieves relevant data from your umbrella sampling simulations. Make sure the folder structure includes correctly numbered subfolders for the same reaction coordinate and system.
 - Choose the Reaction Coordinate: Once the simulation data has been loaded, select the appropriate reaction coordinate for the analysis.
- Fine-Tune Settings: Adjust optional parameters like custom bounds, time ranges, or energy units, depending on your system’s specific needs.
- Generate Results: Click Compute, and the wizard will process your data to create your PMF profile.
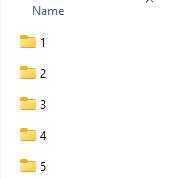
Example Input Folder Organization
For seamless operation, your input data must follow this organizational structure:
Interpreting the Results
Once your calculation is complete, GROMACS Wizard provides two primary outputs:
- The PMF profile, which highlights energy variations along your chosen reaction coordinate.
- A histogram showing coordinate space coverage, which helps you evaluate whether critical regions are undersampled.
Here’s what these results look like:
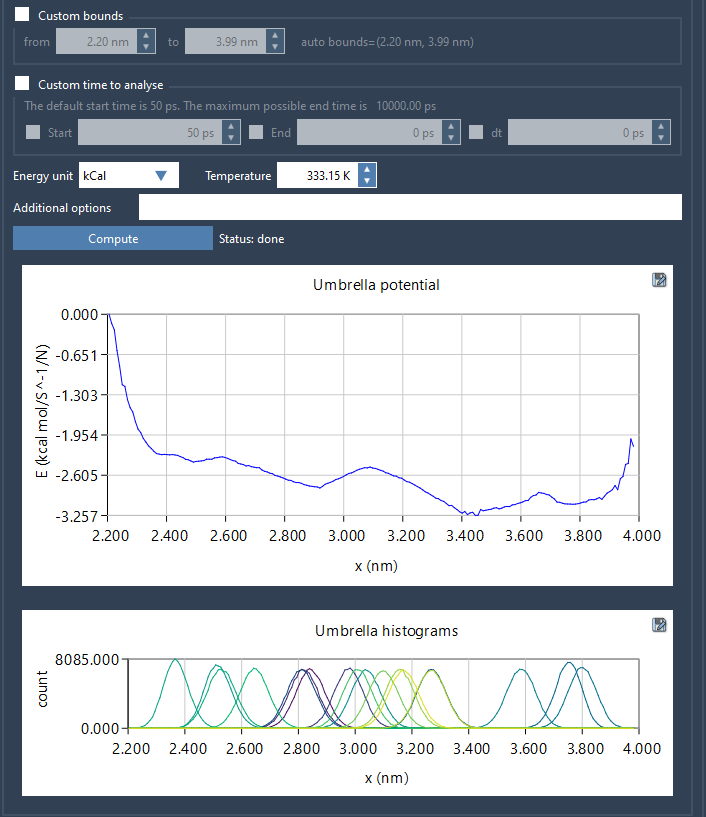
If the histogram reveals insufficient sampling in certain areas, you can revisit the Umbrella Sampling workflow to add or extend simulations for those windows.
Your Next Steps
PMF analysis doesn’t end with generating plots. Use the histogram to ensure proper sampling coverage and refine your simulations as needed. By iterating through umbrella sampling and PMF calculation, you can achieve accurate energy profiles that truly reflect your system’s dynamics and stability.
To delve deeper into this topic, visit the original documentation at https://documentation.samson-connect.net/tutorials/gromacs-wizard/pmf-analysis/.
Note: SAMSON and all SAMSON Extensions are free for non-commercial use. You can access SAMSON at https://www.samson-connect.net.