


For molecular modelers, ensuring residues within a protein structure fall into energetically favorable conformations can feel like navigating a maze. Misplaced residues might lead to inaccuracies in simulations or hinder refinement processes, making this a critical step for achieving reliable results. Enter the Interactive Ramachandran Plot in SAMSON—a user-friendly tool designed to help you visualize, select, and fine-tune residue conformations based on dihedral angles φ (phi) and ψ (psi).
Why Use the Ramachandran Plot?
The Ramachandran plot is a cornerstone visualization in protein modeling. It maps the steric and energetic constraints of backbone dihedral angles, showcasing regions where angles are more likely to result in favorable conformations. This allows scientists to:
- Detect strained residues that may need fixing.
- Refine homology models by focusing on outliers.
- Enhance local flexibility understanding in binding or active sites.
With the Interactive Ramachandran Plot in SAMSON, you can take this static visualization a step further by interacting with residues directly on the plot, making real-time adjustments and ensuring your structure is optimized for downstream workflows.
How to Get Started
If you’re ready to dive in, here’s a quick step-by-step guide to begin exploring protein residue conformations using SAMSON:
- Log in to SAMSON Connect, and install the Interactive Ramachandran Plot Extension. Just click “Add” on the extension page, and restart SAMSON to activate it.
- Load a protein structure. For instance, if you want to use PDB ID
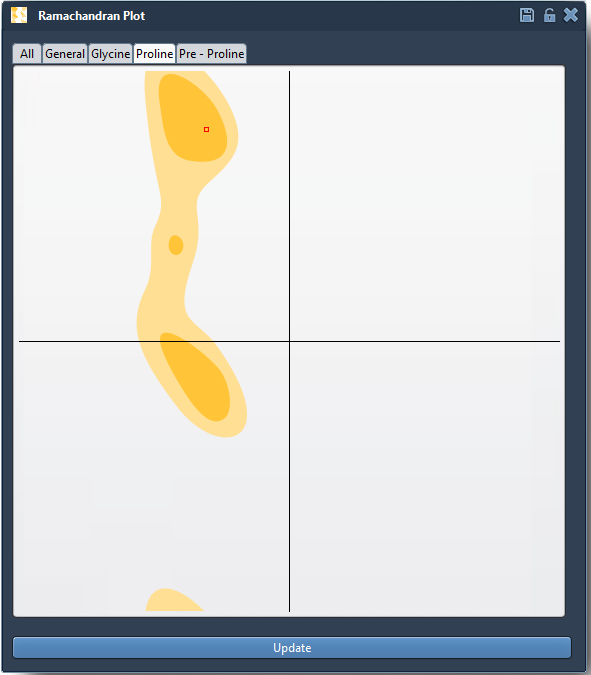
1YRF, navigate to Home > Fetch, input the PDB ID, and click “Load”. - Open the Ramachandran Plot app through Home > Apps > Biology > Ramachandran Plot. Click on “Update” to generate the plot.
You’ll now see a plot highlighting residues based on their placement in energetically favorable (yellow) or unfavorable (white) regions. Using tabs such as “All,” “General,” “Glycine,” “Proline,” or “Pre-proline,” you can categorize residues for easier analysis.
Exploring and Adjusting Residues
One of the standout features of the Interactive Ramachandran Plot is its ability to let you directly interact with individual residues:
- Select Residues on the Plot: Click on any point in the plot to highlight its corresponding residue in the 3D viewport. For instance, clicking a proline dot allows you to focus on its conformation specifically.
- Edit Residues with Live Visual Feedback:
- Drag Points: Simply drag a point on the plot to adjust the residue’s φ and ψ dihedral angles. The 3D structure updates in real time, letting you evaluate the impact visually.
- Undo Changes: Not happy with the adjustment? Use Ctrl/Cmd + Z to revert.
Additionally, using the “Twister editor” available in the viewport, you can manually twist dihedral angles in 3D space. This alternative method provides live updates to the plot, making it easy to refine your structure interactively while maintaining full control over the visualization.
Applications
By combining the analytical power of the plot with interactive capabilities, the tool is powerful for:
- Refining strained residues before simulations to prevent artifacts.
- Validating homology models by assessing and fixing residue conformations.
- Gaining insights into local flexibility in functional regions.
To learn more, visit the full documentation page.
SAMSON and all SAMSON Extensions are free for non-commercial use. You can get SAMSON at www.samson-connect.net.