


Understanding how a ligand navigates through a protein tunnel or binding pocket is crucial in molecular modeling. If you’re analyzing ligand unbinding or conformational transitions, it’s often difficult to see the bigger picture of a movement just by playing through frames. This is where the Pathlines extension in SAMSON becomes especially helpful.
The Pathlines visual model offers a high-level view by drawing the trajectory of the center of mass (COM) of selected atoms along pre-defined paths. It means you can focus on how molecular components—like a ligand—are moving within the system over time, using just one intuitive visual representation.
Why COM Trajectories Matter
Molecular simulations often generate large sets of frames. Manually inspecting each frame to understand motion is inefficient. COM pathlines allow you to analyze complex transitions without getting lost in frame-by-frame navigation. This is especially useful for:
- Visualizing ligand unbinding events
- Tracking domain motions in protein complexes
- Understanding diffusion or reaction coordinates
Step-by-Step: Creating a Pathline
1. Load the Sample System
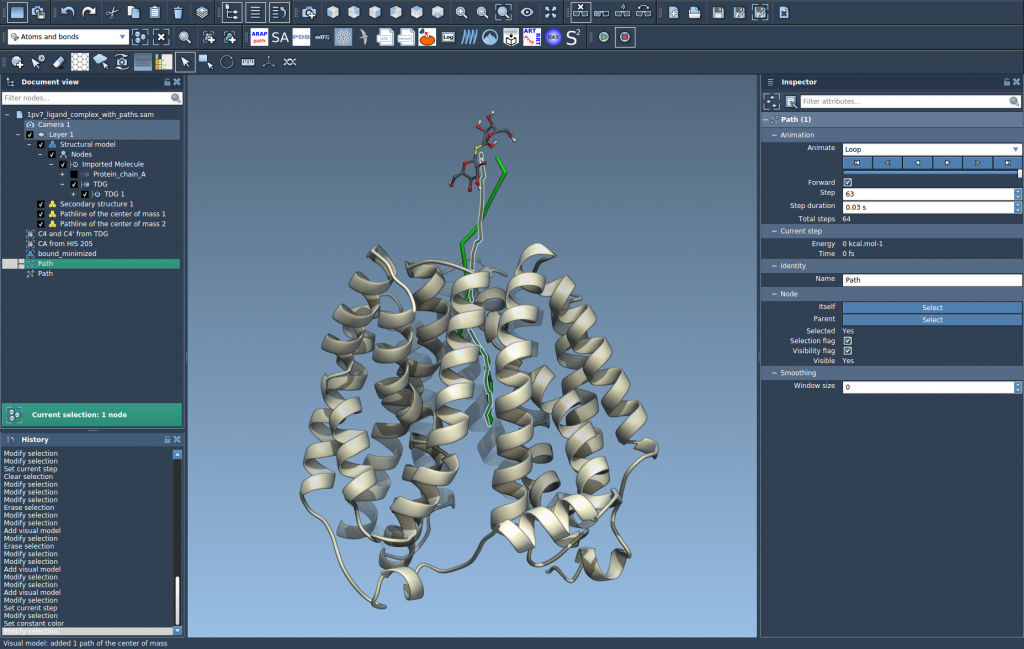
Start by downloading and opening the sample system provided in the tutorial. It contains Lactose permease (1PV7) and its ligand, Thiodigalactosid (TDG), alongside two ligand unbinding pathways. You can load the system by pasting this URL into the “Home > Download” window in SAMSON.

2. Select Atoms and Paths
Using the Document view, select a group of atoms for which you want to compute the COM (e.g., the ligand). Hold Ctrl or Cmd to also select one or more unbinding paths.

3. Create the COM Pathline
Now, generate a visual model:
- Go to Visualization > Visual model > More…
- Choose Pathline of the center of mass
- Click OK

You’ll immediately see a trajectory trace appear, showing the movement of the group’s center of mass throughout the simulation.
4. Customize and Analyze
Use the Inspector panel to adjust line thickness, color, or other visual aspects of your pathline. This helps you highlight or compare multiple trajectories side by side.
You can also interact with paths directly in Document view. Double-click to start or stop a path, or right-click to explore more options from the context menu.

Tips to Get More from COM Pathlines
- Use multiple pathlines to compare how a ligand explores different exit routes
- Visualize how protein domains move relative to one another during conformational transitions
- Combine with energy calculations or NEB paths for deeper physical insight
All these tools make it easier to interpret your data visually and identify biologically meaningful motions with more confidence.
To learn more about how to apply pathline visualization in your projects, visit the full tutorial at https://documentation.samson-connect.net/tutorials/pathlines/pathlines/.
SAMSON and all SAMSON Extensions are free for non-commercial use. You can download SAMSON at https://www.samson-connect.net.