


In molecular modeling, creating smooth and accurate visualizations of molecular transitions is often a challenge. Whether you’re investigating protein-ligand interactions or large conformational changes in biomolecular complexes, understanding the path a molecule takes between two states can be essential for hypothesis generation, drug design, and communicating results. But how do you compute such trajectories efficiently, especially when the two states differ in residue numbers or structural features?
The SAMSON platform offers a useful combination of tools that help molecular modelers build and visualize these transitions. In this post, we show how the ARAP Interpolation Path and P-NEB modules were used to compute the opening motion of the SARS-CoV-2 spike protein, providing a real example of how to handle such conformational changes effectively.
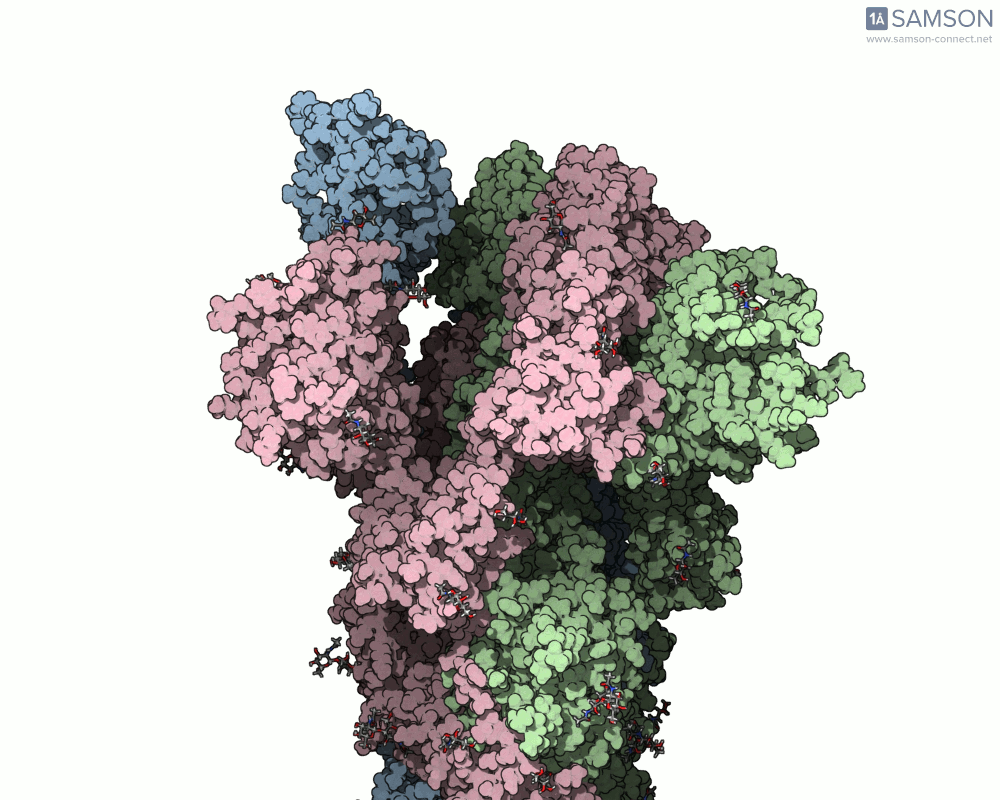
Challenge: Non-identical start and end structures
Consider a case where you have two experimentally-identified conformations of a protein — for example, the closed (PDB 6VXX) and open (PDB 6VYB) structures of the SARS-CoV-2 spike. Because these structures were solved in different conditions, they may differ in the number of atoms or even the presence of certain flexible loops or glycans. This creates a common pain point: how can one interpolate between such differing structures and still obtain a meaningful trajectory?
A practical pipeline in SAMSON
Here’s how SAMSON addresses this issue using complementary tools:
- Preparation: The spike structures were first processed to standardize bond orders in sugars using a Python script within SAMSON’s Python Scripting module, and hydrogens were added using built-in minimization steps.
- ARAP Interpolation: The ARAP Interpolation Path module was used to generate a basic conformational path. The closed conformation (6VXX) served as the goal, and the open conformation (6VYB) as the starting state. This produced an instantaneous rough interpolation — quickly, even on a laptop.
- Resolving Residue Differences: A conformation derived from the ARAP path and adjusted to match the open conformation’s structure was minimized. This became the new target for a second ARAP interpolation step, creating a consistent path based on one reference structure.
- P-NEB Refinement: Finally, the P-NEB (Parallel Nudged Elastic Band) module refined the trajectory to ensure energetic realism by adjusting intermediate frames along the path. This step took only about 15 minutes on a laptop.
What You Get
The end result is a coherent and continuous trajectory that reflects the spike opening transition, all based entirely on structural data processed through SAMSON. These animations can now be used in analysis or for visually communicating protein activation steps.
This workflow can be applied to many other problems where structural transitions are key: allosteric effects, ligand-induced folding, or domain movements in large biomolecular assemblies.
If your models need clear, physics-based interpolations between conformations, try this approach using SAMSON. It removes guesswork from speculative morphing techniques and gives you a reproducible method for transition simulation.
Learn more and access the original full documentation here: Compute SARS-CoV-2 Spike Motion
SAMSON and all SAMSON Extensions are free for non-commercial use. You can download SAMSON at https://www.samson-connect.net.