


When studying large biomolecular assemblies—such as viruses, protein complexes, or synthetic nanomaterials—symmetry isn’t just aesthetic. Identifying and understanding symmetry can help uncover repeated functional motifs, improve structural validation, and dramatically reduce computational demands.
SAMSON’s Symmetry Detection extension brings powerful symmetry analysis to molecular modelers. But once symmetry is detected, making sense of it visually can be tricky—especially when multiple axes or groups are present. The good news? You can significantly improve the clarity and usefulness of your symmetry data by tailoring the visualization to your goals.
Why Focus on Visualization?
Symmetry axes are geometric features. If not visualized properly, they can be difficult to interpret in the molecular context. This can lead to misidentifying asymmetric units or missing opportunities for simplifying models in simulations.
Fortunately, with a few useful techniques you can highlight symmetry in a way that is both informative and ready for publication.
3 Tips for Better Symmetry Visualization
1. Combine Symmetry Axes with Structural Models
Don’t just rely on axis lines floating in space. Overlay symmetry axes with Ribbons or Surface models to provide context. For instance, showing ribbons allows you to see how secondary structure motifs relate to symmetry axes, while surface models give a sense of the overall shape and extent of the molecule.
2. Color Asymmetric Units Differently
When visualizing repeats within a symmetric object, it’s easy to lose track of where one unit ends and another begins. Use color schemes to assign different shades or hues to different chains or asymmetrical units. This makes it easier to spot functional interfaces and understand the extent of repetition.
3. Capture Viewport Snapshots
SAMSON allows you to generate snapshots directly from the viewport. These images can be used in presentations and publications to highlight detected symmetries. Combine clear axis visuals and distinctive colors for impact.
Example: Icosahedral Capsid
SAMSON’s detection of icosahedral symmetry in the viral capsid structure 3NQ4 provides a good demonstration. The software identifies all expected 2-, 3-, and 5-fold symmetry axes and places them within the molecular context.
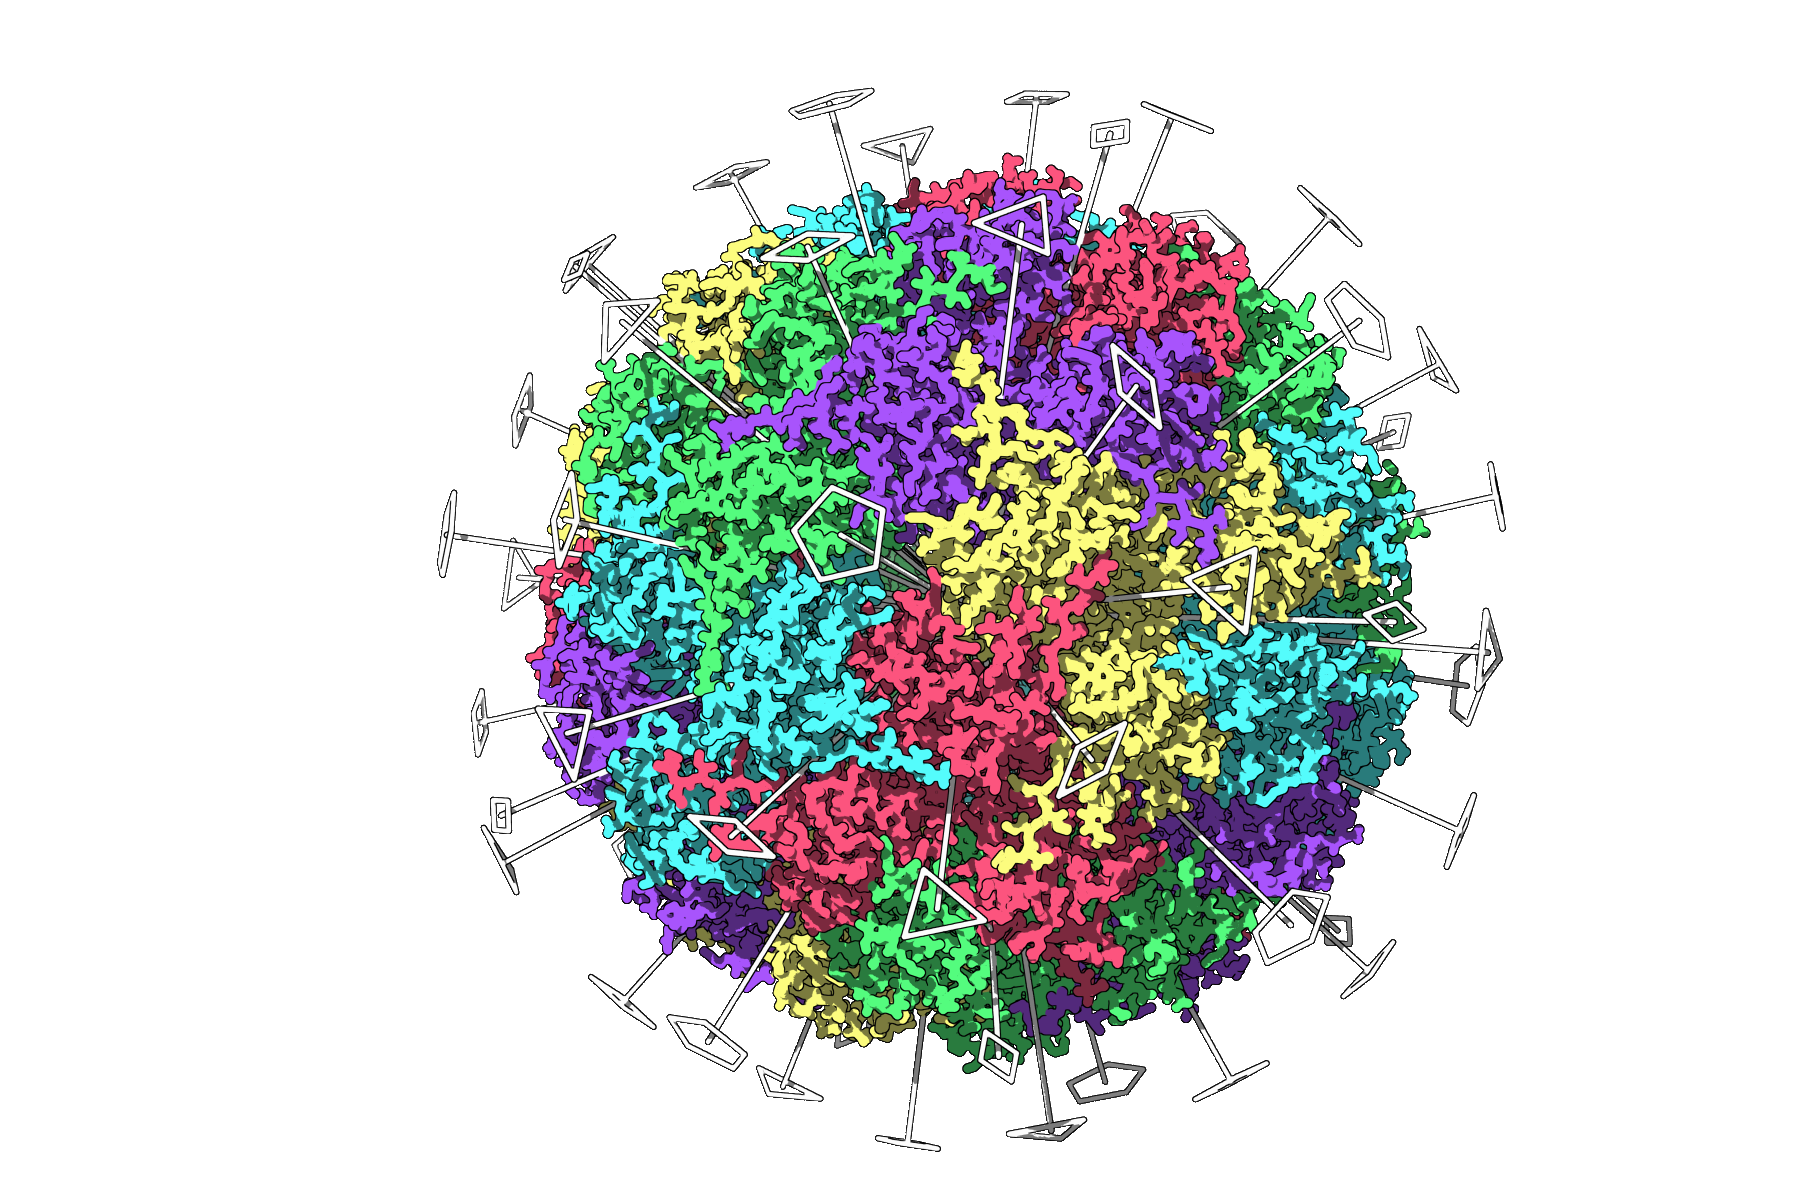
With symmetry axes visualized alongside structural ribbons or surfaces, you can easily isolate a single asymmetric unit before large-scale simulations or edits. This not only helps in reducing resource usage but aids clear communication of your research.
Final Thoughts
Effective visualization of molecular symmetry isn’t difficult, but it requires attention to detail. Whether you’re building a model for a paper, preparing a simulation, or validating a structure, following these visualization tips can clarify your findings and save time.
To explore all visualization and symmetry analysis features and go through step-by-step examples, visit the original documentation at this link.
SAMSON and all SAMSON Extensions are free for non-commercial use. You can download the platform at https://www.samson-connect.net.