If you’ve ever run umbrella sampling simulations in molecular dynamics, you probably know the next step: extracting the Potential of Mean Force (PMF) to understand free energy profiles along a reaction coordinate. But actually going from simulation data to a clear PMF curve can feel like more art than science—dealing with different folders, inconsistent reaction coordinates, and ensuring you chose the right parameters for Weighted Histogram Analysis Method (WHAM) is often a bit of a headache.
The GROMACS Wizard in SAMSON offers a much more straightforward approach to PMF analysis. Let’s break it down.
Why do PMF calculations often feel complicated?
Molecular modelers typically need to compute a PMF to quantify free energy changes along a reaction coordinate, such as the distance between atoms or groups. This is central to many design and research projects: from understanding ligand binding to membrane permeation.
The trouble is, after running umbrella sampling simulations—often in batch mode—you’re left with a collection of subfolders named with different positions or force constants. Organizing these consistently, parsing outputs, and feeding the right segments into WHAM requires accuracy and time.
A smoother workflow with GROMACS Wizard
After completing umbrella sampling (guides for which are here), open the WHAM Analysis tab in GROMACS Wizard. You can then either select your project path or click an auto-fill button to fetch the path from your last session:

The Wizard reads in data automatically: reaction coordinates, simulation times, temperature—saving you from manually entering this information. The input folder should be organized with numbered subfolders (e.g. 01, 02, …, N) each containing outputs from your umbrella sampling windows, like this:

Just choose and compute
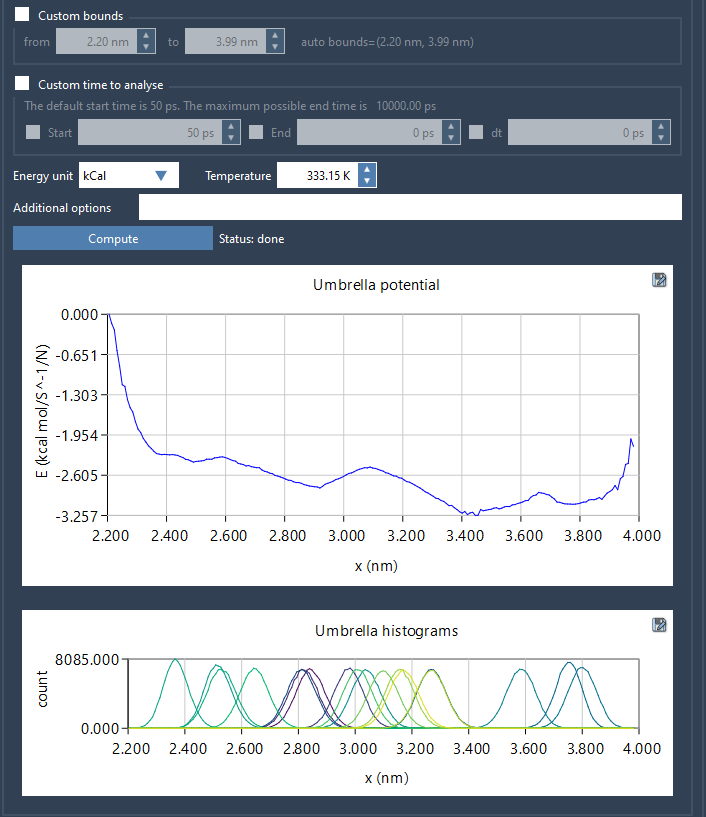
Once the folder is loaded, select a reaction coordinate from the list. If needed, customize the bounds, simulation time, or energy units. Then click Compute.
Two plots are generated:
- A PMF profile
- A histogram of coordinate sampling
These give a clearer picture of your system. If the histogram shows uneven sampling, you might consider running more simulations in under-sampled areas:

What happens behind the scenes?
All output (plots, histogram data, energy profiles) is saved automatically in a wham_results subfolder. When you toggle between reaction coordinates or re-open your project later with the same parameters, precomputed data is reused—no need to recompute from scratch.
Final thoughts
With GROMACS Wizard in SAMSON, PMF analysis becomes more accessible and less error-prone. By reducing manual steps and automatically managing input data and output storage, it helps you spend more time analyzing and less time debugging.
To learn more, visit the full documentation page here: https://documentation.samson-connect.net/tutorials/gromacs-wizard/pmf-analysis/
SAMSON and all SAMSON Extensions are free for non-commercial use. You can get SAMSON here.


