


Validating and refining protein structures can be a challenging task for molecular modelers. Modeling accuracy directly impacts the success of simulations, predictions, and experimental designs. One particularly useful tool to address these challenges is the Interactive Ramachandran Plot provided by the SAMSON platform. This blog post will walk you through how to leverage this tool to explore and perfect protein backbone conformations.
Why Use a Ramachandran Plot?
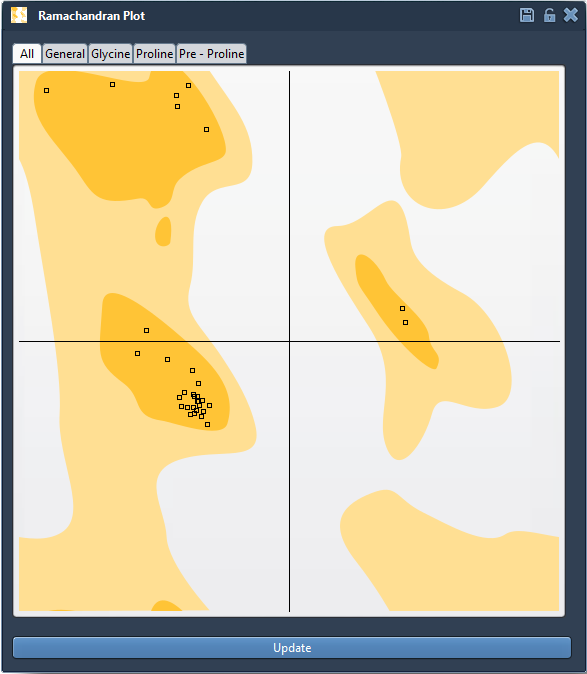
A Ramachandran plot is a crucial visualization tool in molecular modeling for evaluating the backbone dihedral angles of amino acid residues, φ (phi) and ψ (psi). By plotting these angles, it highlights energetic regions that are favored and unfavorable in protein structures:
- Yellow areas represent energetically favorable regions, indicating stable conformations.
- White areas represent regions that are energetically unfavorable due to steric or energetic constraints.
This distribution offers insights into which residues are well-placed and which might need optimization for better structural reliability.
Getting Started with the Interactive Ramachandran Plot
To start using the tool, simply add the Interactive Ramachandran Plot Extension to your SAMSON workspace:
- Log into your SAMSON Connect account.
- Visit the Interactive Ramachandran Plot extension page and click Add.
- Restart SAMSON to enable the extension.
Visualizing Protein Structures in the Plot
Once the extension is activated, you can visualize and interact with your proteins in an intuitive way. Let’s take the example of loading the protein with PDB ID 1YRF:
- Go to Home > Fetch and input
1YRFinto the PDB section. - Click Load to view the structure in your viewport.
To access the Ramachandran plot, navigate to Home > Apps > Biology > Ramachandran plot. Once opened, click Update to generate the plot. It organizes the residues into different categories (e.g., Glycine, Proline), allowing detailed filtering and exploration:
- Residues located in yellow areas are correctly placed conformationally.
- Outliers in white areas may require further refinement.
Refine Structures Like a Pro
Editing residues to fix unfavorable regions has never been easier. Here are two main methods:
1. Dragging Points in the Plot
Simply drag a point representing a residue to adjust the φ and ψ angles. The changes instantly update the 3D structure in your workspace, providing immediate feedback on the conformational adjustments. If you’re unsatisfied with the result, use Ctrl/Cmd + Z to undo.
2. Using the Twister Editor
The Twister editor offers an alternative interactive way to refine residue angles. Select it from the left-hand menu in the viewport, twist the structure in 3D space, and watch the Ramachandran plot update live:
From Validation to Insight
With the Interactive Ramachandran Plot, you can go beyond checking energy-favored regions. You can:
- Identify and fix strained residues, ensuring smoother protein dynamics during simulations.
- Refine homology models to improve the reliability of predictions.
- Explore conformational flexibility, especially in active or binding sites.
Learn More
To dive deeper into the Interactive Ramachandran Plot and explore all available features, visit the original documentation page here.
SAMSON and all SAMSON Extensions are free for non-commercial use. Get started today at SAMSON Connect.