



Molecular modeling often involves understanding how two groups of atoms interact over a path or trajectory. Whether tracking binding-site opening, monitoring changes in domain motion, or simply analyzing contact points between specific features, precise distance analysis can be a game-changer. With SAMSON’s Path Analyzer and its Distance feature, you have access to a highly versatile tool for these tasks. This blog post will guide you through leveraging this feature to solve a persistent challenge faced by molecular modelers: efficiently analyzing inter-group distances.
What is Distance Analysis?
The Distance analysis in SAMSON helps you quantitatively measure how far two groups of atoms are from each other along a given path or trajectory. This type of analysis is particularly useful when you need to:
- Monitor the opening and closing of binding sites.
- Track interactions (such as hydrogen bonds or Van der Waals contacts).
- Study the motion between protein domains.
Using a flexible setup, it enables you to define the groups and measure distances in various modes, such as centroids or closest atomic pairs, making it adaptable to your specific modeling needs.
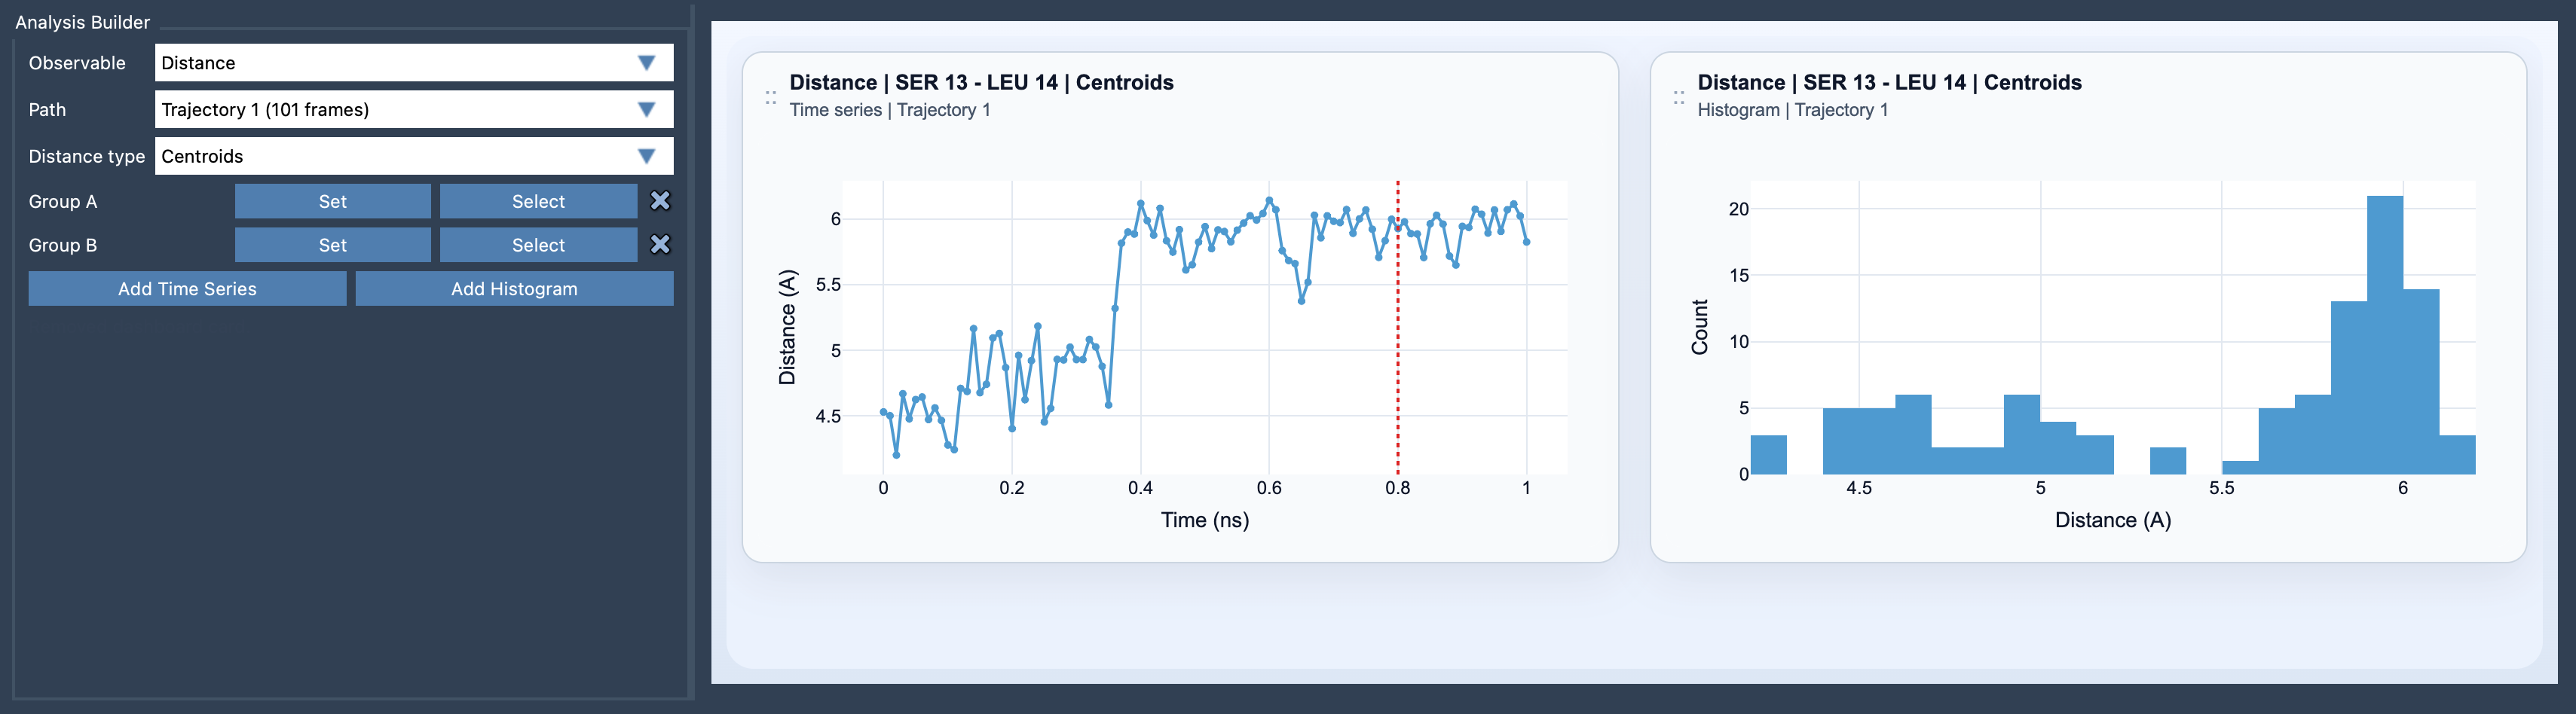
How to Set Up a Distance Analysis
Follow these steps to start your Distance analysis:
- Open the Path Analyzer in SAMSON.
- Select Distance as the observable under analysis settings.
- Define your Group A and Group B. Each group should be atom-containing, such as specific residues, domains, or chains.
- Choose your Distance type: centroid-based or one of the minimum-distance modes.
- Click to display results either as a Time Series (distance over time or path steps) or a Histogram (distance distribution).
When to Use Centroids or Minimum Distances
One of the more nuanced aspects of Distance analysis is choosing the right mode. Here’s a simple breakdown:
- Centroids: This mode averages all atom positions to create a geometric centroid for each group and measures the distance between these centroids. It is excellent for capturing smooth, high-level motion signals between groups, such as domain movement.
- Minimum: Instead of simplifying groups into a single point, this mode identifies the smallest distance between any atom in Group A and any atom in Group B. It’s ideal for pinpointing exact contact points, such as during docking or contact analysis.
You can further refine minimum-distance analysis by orienting it along specific axes (X, Y, or Z) to examine motion in one dimension.
Visualizing and Interpreting Results
After setting up your analysis, results can be observed in two ways:
- Time series: A detailed chart showing distance variations along the path, helping you identify patterns or events.
- Histogram: A distribution representation of sampled distances. This is helpful for understanding how distances are spread across trajectories.
Pro Tips for Effective Use
Here are some suggestions to make the most of the Distance feature:
- For chemically specific tracking, choose smaller groups like a few key residues.
- If you want broader trends, analyze larger groups, such as entire domains or chains, for a coarse-grained signal.
- Saved Distance analyses can be used as input for advanced modules like Custom Scatter or Energy Landscapes to integrate with other data.
Understanding molecular movements and interactions can be greatly simplified with the right tools. Explore the Distance analysis feature to bring clarity to complex trajectories and enhance your modeling workflows. For a detailed guide, visit the original documentation page: https://documentation.samson-connect.net/users/latest/references/path-analyzer/distance/.
SAMSON and all SAMSON Extensions are free for non-commercial use. Get SAMSON at https://www.samson-connect.net.