



Understanding molecular motion is a key challenge in molecular modeling. Whether you’re investigating how a ligand unbinds from its target protein or exploring macromolecular conformational changes, tracking these motions in detail can feel daunting. The good news is that SAMSON offers a powerful visual model called Pathlines to help you visualize the center-of-mass (COM) motion of selected atoms along paths generated from simulations. Here’s how it works and why this could become one of your most valuable tools.
The Problem: How to Track Complex Molecular Movements?
When working with molecular systems, analyzing how molecules or functional groups move over time is often key to understanding biological processes. But in complex environments, visualizing these movements effectively can be a challenge. 2D projections or numeric tables of data might not intuitively convey motion across dynamic simulations. For molecular modelers, the ability to clearly see the motion can be a game-changer.
Why Pathlines Make a Difference
SAMSON’s Pathlines provide an elegant way to address this challenge. By enabling the visualization of COM trajectories, this feature helps you:
- Track the motion of specific ligand groups, residues, or atoms over defined paths.
- Analyze motion in complex systems, such as protein-ligand unbinding mechanisms or diffusion processes in enzymatic cavities.
- Understand conformational shifts in macromolecular domains more effectively.
With Pathlines, dynamic movements become clearer as sleek visual representations emerge directly in your workspace.
Getting Started: Visualizing Center-of-Mass Motion in 4 Simple Steps
Here’s a step-by-step overview to use Pathlines in SAMSON:
1. Load Your System
First, ensure you’ve loaded your molecular system. For example, the Lactose permease system (1PV7) is available for practice. Download the sample document from here (see image below):

2. Select Atoms and Paths
In the Document view, select a group of atoms you want to analyze. You can also select one or more paths that represent trajectories (hold Ctrl / Cmd to select multiple nodes). If nothing is selected, SAMSON will default to using the entire system and all paths available in the document.

3. Create a Pathline Model
To add a visual model:
- Go to Visualization > Visual model > More… (shortcut: Ctrl/Cmd + Shift + V).
- Choose Pathline of the center of mass from the dialog and click OK.
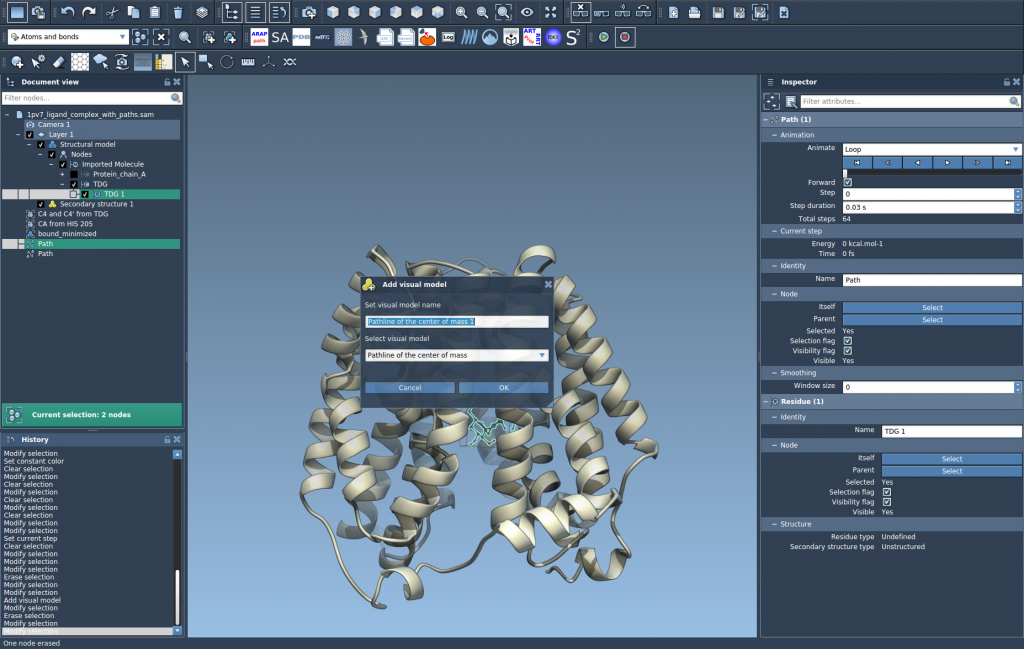
A visual pathline will now appear in your scene, showing the COM motion along the selected path(s).
4. Customize and Explore
Once you’ve generated a pathline, take full advantage of its flexibility:
- Double-click a path in the Document view to toggle animations on/off.
- Access further options by right-clicking a path and selecting Path > ….
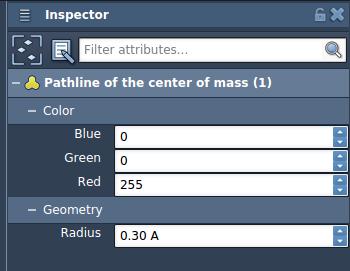
- Use the Inspector (Ctrl/Cmd + 2) to modify properties such as color and thickness, or adjust the animation parameters.
Applications and Next Steps
Applications for Pathlines are diverse. You can:
- Track ligand unbinding routes across simulations.
- Visualize domain motions in protein complexes to explore structural reorganizations.
- Analyze reaction pathways by observing the center-of-mass motion.
Ready to go further? You can also refine paths generated in your system by combining Pathlines with SAMSON’s P-NEB (Parallel Nudged Elastic Band) extension.
Learn more about visualizing center-of-mass trajectories with Pathlines in the full documentation: https://documentation.samson-connect.net/tutorials/pathlines/pathlines/.
Note: SAMSON and all SAMSON Extensions are free for non-commercial use. Download SAMSON today at https://www.samson-connect.net.