


Protein modelers frequently run into a recurring challenge: identifying and correcting residues with unfavorable backbone conformations. These problematic residues can undermine the structural integrity of simulations, reduce model accuracy, and even produce misleading results in docking or dynamics. Fortunately, SAMSON’s Interactive Ramachandran Plot Extension offers a precise and visual way to manage this issue directly within your molecular modeling workflow.
Why Dihedral Angles Matter
At the core of this tool lies the Ramachandran plot – a graph that maps each residue’s backbone dihedral angles φ (phi) and ψ (psi). It shows which conformations are sterically and energetically allowed. Residues that lie outside favored regions may be incorrectly folded or strained, and this needs to be fixed before simulation or analysis.
Visualizing Your Protein
The first step is loading your protein. For example, load PDB ID 1YRF in SAMSON via Home > Fetch. Then, access the Ramachandran Plot app via Home > Apps > Biology > Ramachandran plot.
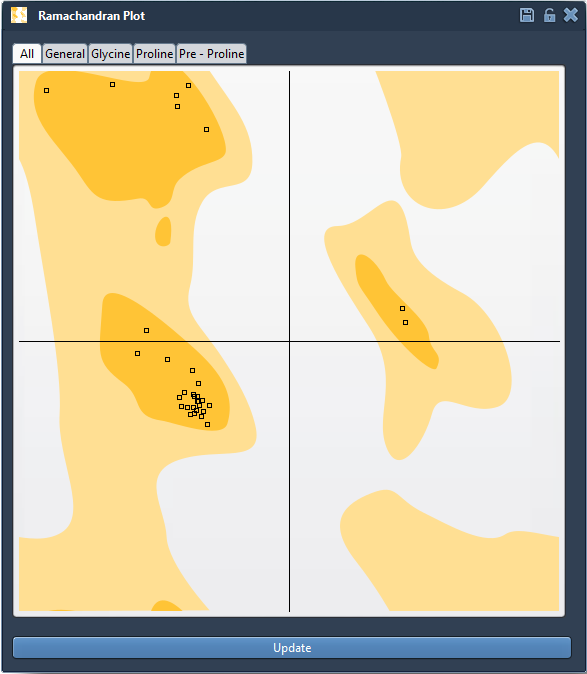
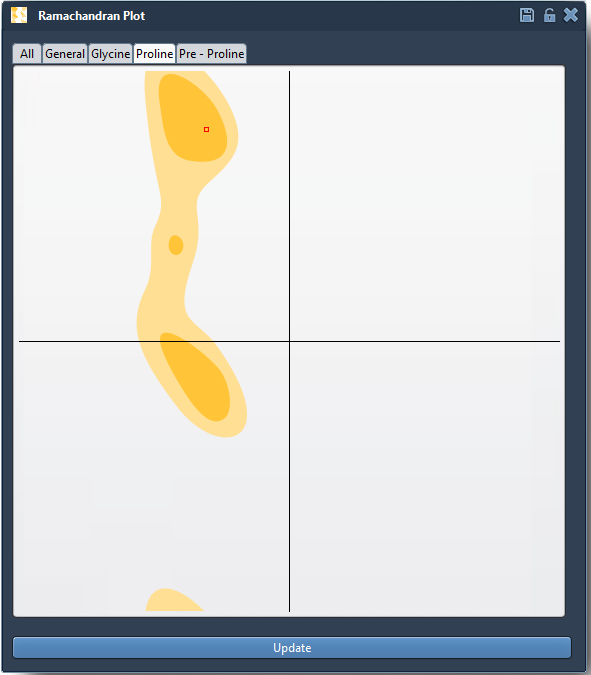
The plot clearly marks the allowed regions (in yellow) and disallowed ones (in white). Residues appear as dots representing their φ/ψ combination, and are grouped by residue type: general, glycine, proline, and pre-proline. You can quickly locate outliers that may be energetically unfavorable.
Click, Explore, Inspect
Interacting with the plot is direct and intuitive. Click on a residue dot to:
- Highlight the associated residue in the 3D viewport
- Read its precise φ/ψ angles in the status bar

Interactively Fix Outliers
Once a problematic residue is found, you can fix it directly using one of two methods:
1. Drag in the Plot
- Click and drag a point on the plot to adjust φ and ψ angles in real time
- Observe the instant update on the 3D protein structure
- Undo changes anytime with
Ctrl/Cmd + Z
2. Use the Twister Editor
- Activate the Twister tool from the left-hand menu
- Interactively rotate backbone segments and see the plot update live
Why This Matters
Validating and correcting φ/ψ angles is an essential step before running simulations or interpreting biological mechanisms. The interactive plot in SAMSON helps ensure your protein models start from physically realistic conformations. Whether you work on homology models, flexible regions, or active sites, this inspection step adds confidence and saves time later.
Learn more in the full documentation here: SAMSON Interactive Ramachandran Plot
SAMSON and all SAMSON Extensions are free for non-commercial use. You can get SAMSON at https://www.samson-connect.net.