



When a molecular structure looks crowded, it is natural to ask: are two groups actually arranged at preferred distances, or do they just happen to be near each other in this snapshot? A radial distribution function (RDF) helps answer that question by summarizing how often atoms from one group occur at different distances from atoms in another group along a path.
This is useful for exploring local packing, solvation structure, and characteristic interaction distances. But an RDF is easy to misread if you overlook what is being counted, how the curve is normalized, or how your selections and bin width shape the result.
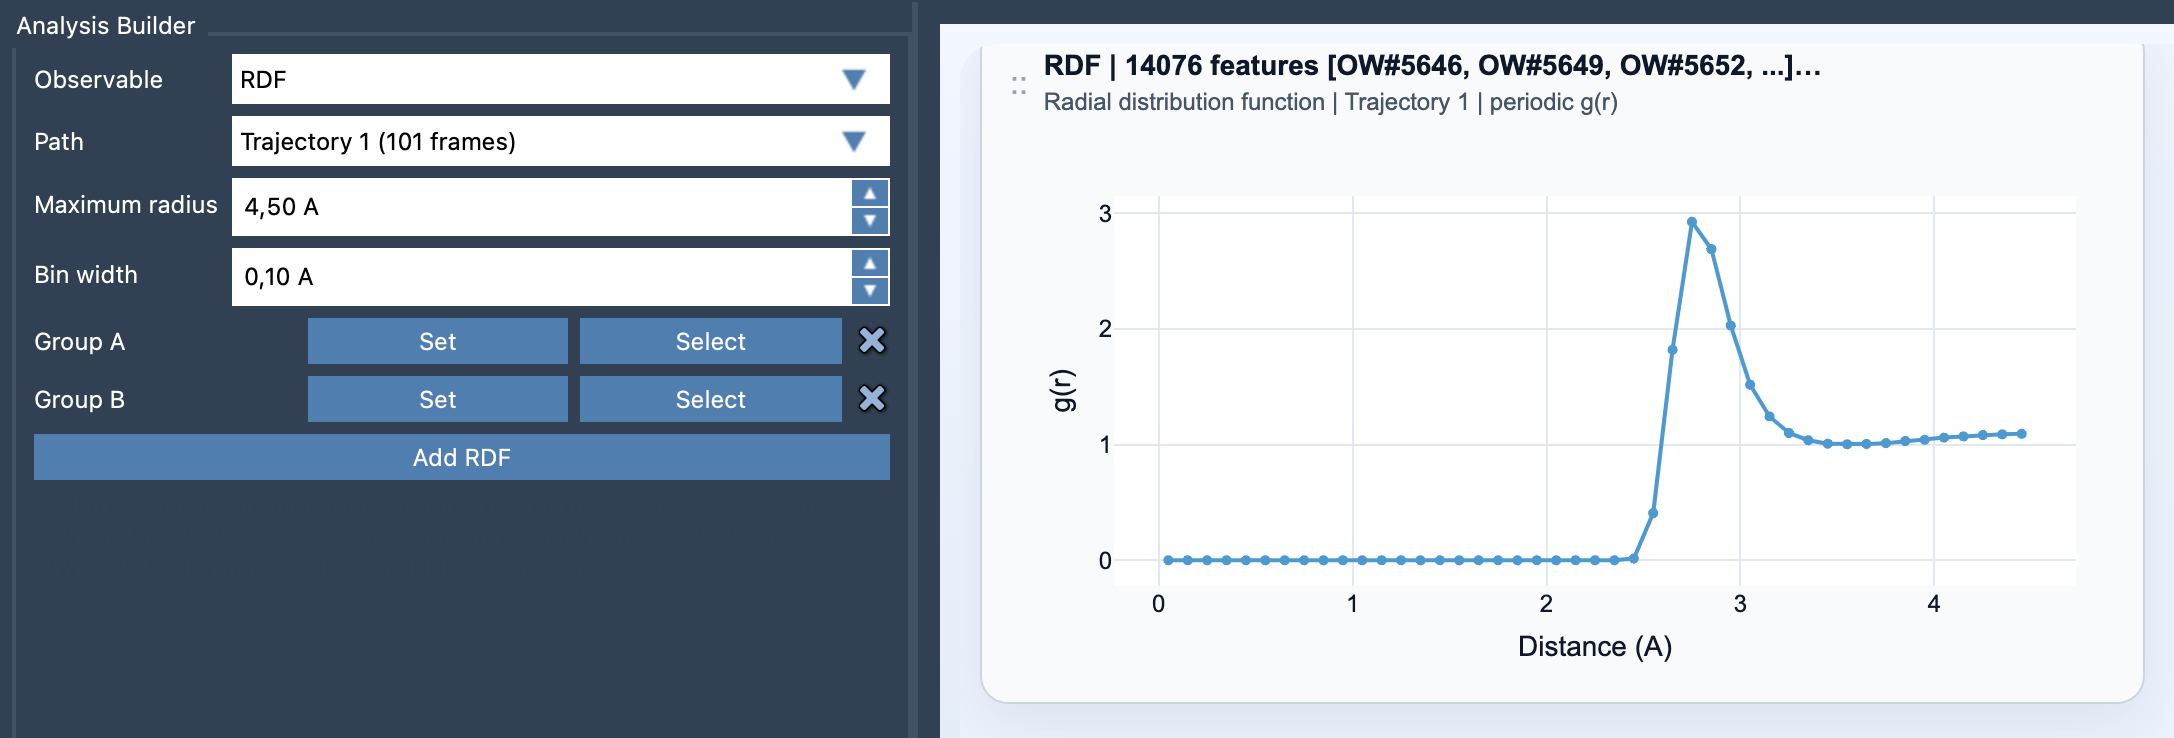
What the curve is telling you
At its simplest, an RDF groups sampled pair distances into narrow distance intervals, or shells. For a shell near distance r, the count is related to the number of pairs in that shell, n(r), and the shell volume, approximately 4πr²Δr. The shell volume matters: even if the local density were uniform, larger shells have more space in which to contain atoms. That is why a raw pair count should not automatically be interpreted as a change in molecular preference.
When valid periodic unit-cell information is available, Path Analyzer can normalize against the expected ideal-gas occupancy of the shell and report a dimensionless-style g(r). In broad terms, this scaling makes it easier to see where observed pair density differs from a uniform reference. If periodic normalization is not possible, the app instead displays an RDF-like curve in arbitrary units. That curve can still show patterns in the sampled counts, but its scale should not be treated as a properly normalized g(r).
Start with a question, not a curve
Before adding a plot, decide what relationship you want to inspect. For example, you might ask how solvent atoms distribute around a solute, how a ligand relates spatially to a selected pocket group, or how two residue subsets are arranged. Then define Group A and Group B to match that question. Both selections must contain atoms.
This choice is not a small setup detail: the RDF describes the pair distances between the groups you selected. If a group includes atoms that are chemically or structurally unrelated to the question, the resulting curve may combine several different patterns. Use chemically meaningful selections and keep the interpretation tied to those selections.
Set the distance range and resolution
The Maximum radius sets how far out the distribution is sampled. Choose a range that covers the distances relevant to your question; extending it farther is not automatically more informative. The Bin width controls the radial resolution. A smaller width can help resolve nearby features, but if it is too small the curve may become noisy. A wider width smooths the sampling but can blur features that are close together.
A practical approach is to begin with a reasonable range and bin width, inspect the curve, and adjust the width if the pattern looks either overly jagged or too smoothed out. Treat this as a balance between detail and stability, not as a hunt for the most visually dramatic plot.
Build and interpret the plot
- Open Path Analyzer.
- Choose RDF as the observable and select a path.
- Define atom-containing Groups A and B.
- Set the maximum radius and bin width, then click Add RDF.
Look for distance ranges where the curve changes consistently, and relate those features back to the groups and path you analyzed. A peak can point to a distance range where pairs are commonly found in the sampled data; it is a clue about spatial organization, not by itself proof of a particular bond, binding event, or cause. Check the selections and normalization context before comparing curves or drawing conclusions.
One more detail affects interpretation: RDF cards summarize the path globally and are not linked to individual frames. They are therefore useful for an overall view of the sampled path, but do not show when a distance pattern occurred. If timing or frame-specific behavior matters, the global RDF alone cannot tell you that.
For setup details and the equations, see the RDF documentation.
Note: SAMSON and all SAMSON Extensions are free for non-commercial use. Get SAMSON at samson-connect.net.