



Molecular modelers often face the challenge of optimizing protein structures effectively while ensuring all residues conform to energetically favorable regions. This process can be daunting, especially when working with complex protein models. The Interactive Ramachandran Plot tool in SAMSON provides a solution that allows for real-time inspection and editing of protein backbone dihedral angles, making structure refinement more intuitive and efficient. Let’s explore how this can be done in just a few steps.
Why Use the Interactive Ramachandran Plot?
The Ramachandran plot is a widely recognized tool for visualizing the ψ (psi) and φ (phi) dihedral angles of protein residues. It distinguishes energetically allowed regions (in yellow) from disallowed conformations (in white). This distinction helps identify strained amino acids that may need correction, ensuring the accuracy of your protein model before simulations or further analysis.
SAMSON’s Interactive Ramachandran Plot goes beyond visualization. It enables users to directly edit these dihedral angles and observe immediate updates in the protein’s 3D structure. This interactive approach saves time and offers precise control over residue conformations.
Two Ways to Edit Dihedral Angles
Option 1: Dragging Directly Within the Plot
- After opening the Ramachandran plot app in SAMSON, click on individual points representing residues on the plot.
- Click and drag a point to adjust the corresponding φ and ψ angles. Residues update in real time within the 3D protein structure view.
- If you make an unwanted change, simply undo it by pressing Ctrl/Cmd + Z.
This approach combines graphical and tactile control, allowing you to instantly see the structural consequences of your changes.
Option 2: Applying the Twister Editor
- Select the Twister editor tool from the left-hand menu in SAMSON.
- Interact with the 3D representation of your protein. When you twist parts of the structure, the plot updates in sync, showcasing how each change affects backbone angles.
This method enables a more hands-on approach for those who prefer working interactively directly within the 3D protein model.
Visual Feedback as You Edit
The Ramachandran plot provides clear visual feedback while editing. Areas marked in yellow signify energetically favorable regions, while white areas indicate unfavorable conformations. Additionally, tabs within the application allow you to filter residues into specific categories, such as Glycine, Proline, or Pre-proline, for more targeted adjustments.
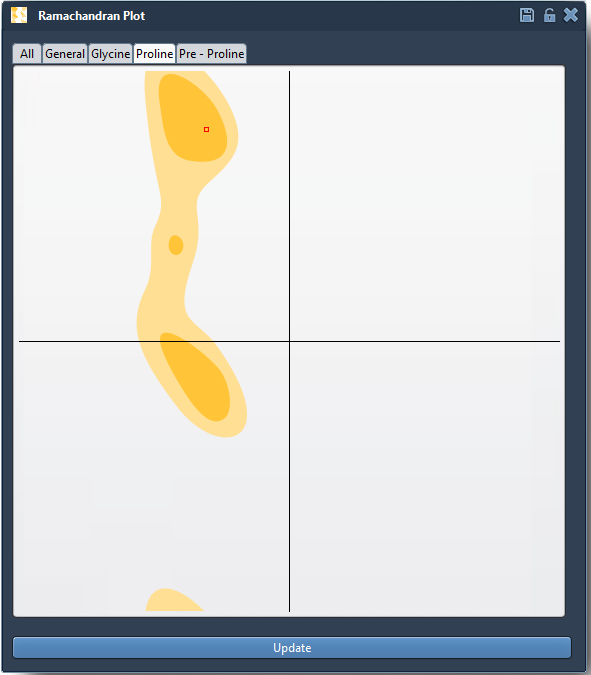
For example, clicking on a Proline residue highlights it within the 3D view, showing its current ψ and φ values in the status bar. This seamless integration of visuals, 3D models, and quantitative data makes refinements straightforward and accurate.
Why Refine Protein Models This Way?
- Detect strained or unnatural conformations before running simulations, preventing potential downstream inaccuracies.
- Refine homology models by conveniently correcting outlier residues visible in the plot.
- Study and optimize conformational flexibility in active sites or binding interfaces.
These interactive editing capabilities streamline the refinement process, making SAMSON an invaluable platform for anyone working in molecular modeling.
Learning More
For detailed instructions on using the Interactive Ramachandran Plot, visit the full documentation page at https://documentation.samson-connect.net/tutorials/ramachandran/ramachandran-plot/.
Note: SAMSON and all SAMSON Extensions are free for non-commercial use. You can get SAMSON at https://www.samson-connect.net.