



For molecular modelers, understanding how a structure changes over time is essential for studying dynamics, interactions, and overall molecular behavior. However, deciphering whether these changes are due to local structural rearrangements or overall rigid-body motion can be challenging. This is where Root Mean Square Deviation (RMSD) analysis becomes a valuable ally.
Why Use RMSD Analysis?
RMSD analysis helps you track how much your molecular structure deviates from a reference, particularly the first frame of a simulation. After aligning each frame using a specific fit set, RMSD focuses on the internal changes in a measured set. This makes it one of the most practical tools for separating overall rigid-body translations and rotations from meaningful internal structural dynamics.
For example, if you are studying a protein-ligand complex, you might use RMSD to observe how binding pockets shift while excluding global translations. Or, if you’re exploring a flexible biomolecule, you can pinpoint which regions undergo conformational changes.
Breaking Down RMSD Analysis in SAMSON
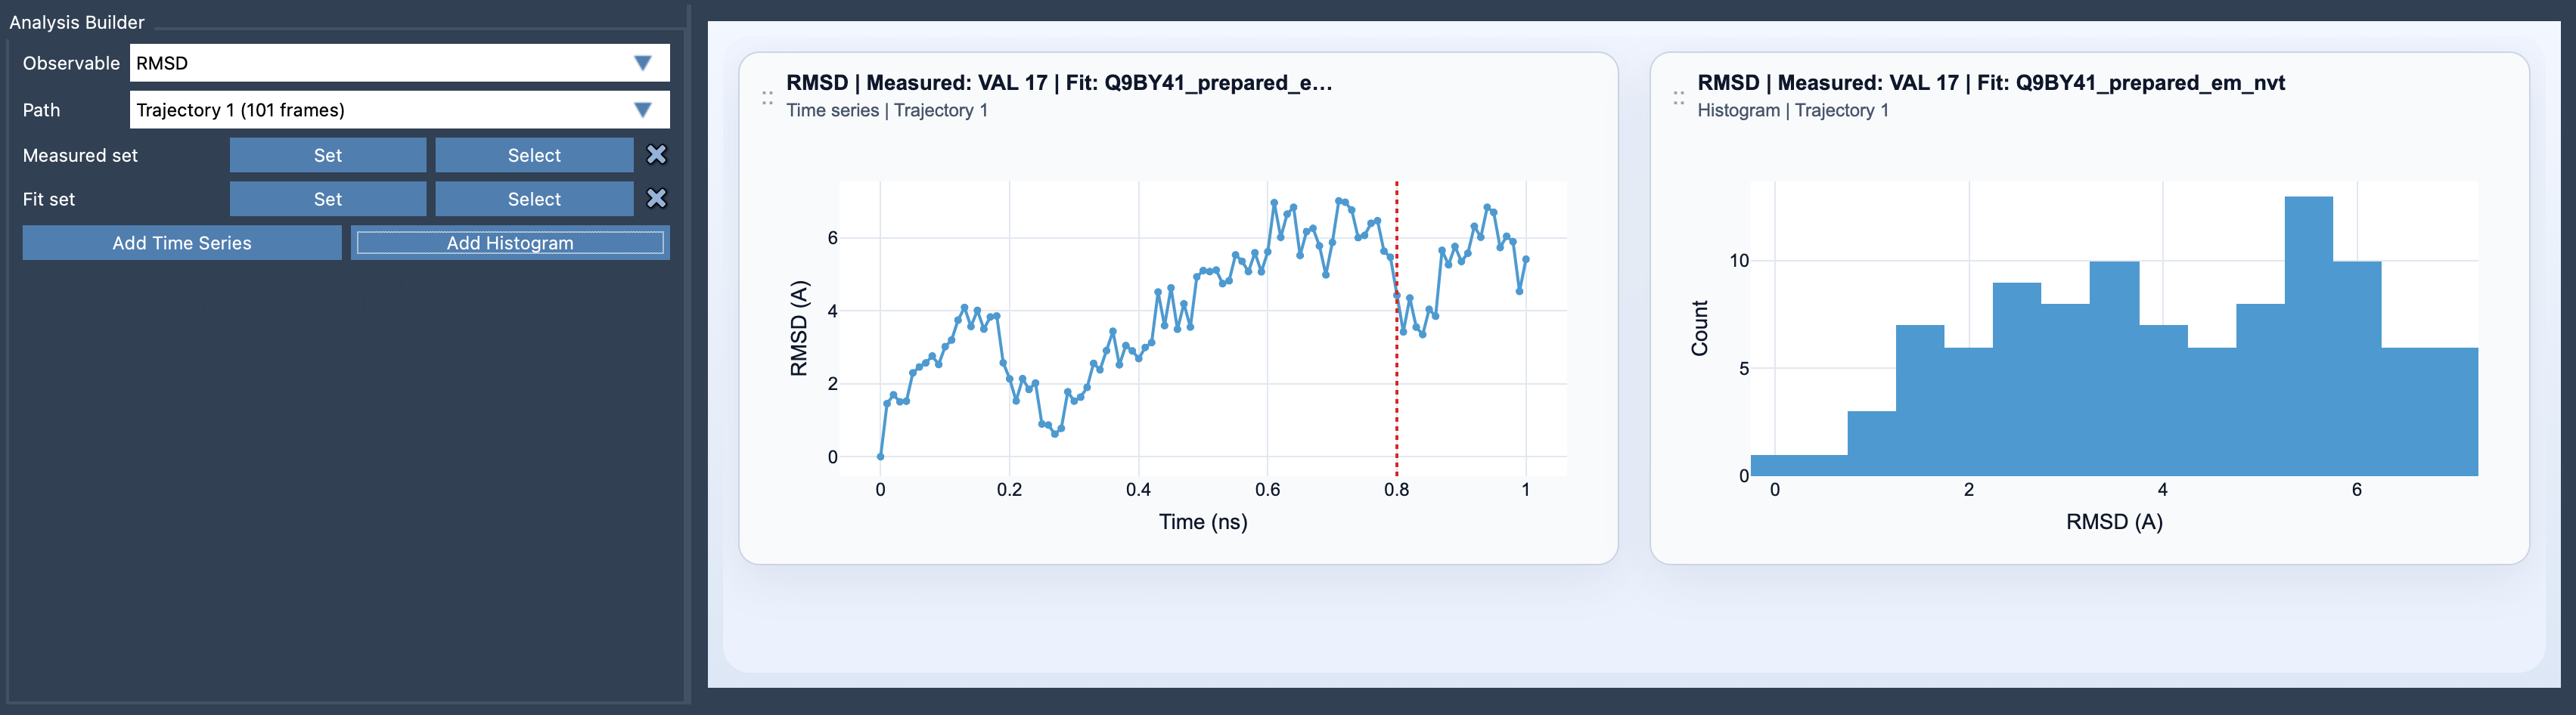
With SAMSON’s Path Analyzer, setting up an RMSD analysis to monitor structural deviations becomes straightforward. Here’s a brief guide to getting started:
- Open the Path Analyzer.
- Select RMSD under the Observable menu.
- Define the Fit set—the atoms used for frame alignment—and the Measured set, which tracks deviations post-alignment.
- Choose between a Time series plot (to observe frame-by-frame deviations) or a Histogram (to analyze the RMSD value distribution).
Aligning Frames for Better Insights
How you define the fit set and the measured set significantly impacts the quality of your RMSD analysis. For best results:
- Use a stable segment as the fit set, such as a protein’s core, backbone, or a rigid scaffold. This ensures accurate frame alignment.
- Choose a flexible region, like a ligand or loop, as the measured set to isolate local rearrangements effectively.
By strategically selecting these sets, you can achieve a clearer understanding of specific molecular behaviors that drive functional changes.
Visualizing Results
SAMSON’s Path Analyzer allows you to view results through two complementary graphs:
- Time Series: Tracks frame-by-frame structural deviation, offering a continuous view of how the system evolves dynamically.
- Histogram: Provides a statistical snapshot of RMSD values, helping you identify trends or outliers in conformational variations.
By combining these views, you can not only detect significant deviations but also interpret the context behind them, whether correlated with energy changes, binding events, or other molecular processes.
A Key Equation
The RMSD is calculated using a simple formula that averages the square of atomic deviations across all atoms in the measured set and takes the square root of the result. After aligning each frame using the fit set, the equation is:
Here, ri(t) represents the positions of measured-set atoms at time t (after alignment), and ri(0) corresponds to their positions in the reference frame.
Tips for Effective RMSD Analysis
Leverage these strategies to maximize the value of your RMSD analysis:
- Combine RMSD analysis with complementary observables like Radius of gyration, Distance, or Energy for a deeper understanding of structural dynamics.
- Explore the interactive features of SAMSON: Clicking on a graph point moves the molecular path to the corresponding frame, and double-clicking selects the measured atoms.
Such features make it easier to correlate visual results with molecular processes.
Get Started
To learn more about setting up and interpreting RMSD analysis, check the full documentation at SAMSON RMSD Documentation.
SAMSON and all SAMSON Extensions are free for non-commercial use. Start exploring molecular dynamics by downloading SAMSON at https://www.samson-connect.net.