



For molecular modelers, understanding the motion of molecules and their components is a crucial task. Whether you’re investigating ligand unbinding, studying protein conformational changes, or analyzing collective atomic motion, visualizing the movement of the center of mass (COM) can provide valuable insights. The Pathlines visual model in SAMSON offers a straightforward solution to this challenge, allowing you to trace molecular trajectories efficiently.
What Are Pathlines and Why Use Them?
Pathlines are streamlined visual representations of the center-of-mass motion of a specified group of atoms along predefined paths. By mapping this motion, molecular modelers can gain clear insights into dynamic processes like:
- Ligand unbinding or rebinding trajectories
- Diffusion and other dynamic movements
- Protein domain shifts or other macromolecular conformational changes
Rather than manually tracking complex sets of coordinate changes, Pathlines provide a clean and visual alternative to summarize atomic and molecular behaviors over time.
Step-by-Step Guide to Using Pathlines
If you’re ready to streamline your workflow, here’s how to use the Pathlines visual model in SAMSON:
1. Load the Sample System
Begin by loading a sample molecular system to practice creating Pathlines:
- Navigate to Home > Download in SAMSON.
- Paste the following URL into the download field: https://www.samson-connect.net/documents/046f1acd-c799-40f6-8185-cb4847eff795.
- Click Download to retrieve a document containing the Lactose permease structure (
1PV7) and its ligand Thiodigalactosid (TDG) along with predefined unbinding paths.

2. Select Atoms and Paths
Once you’ve loaded the sample system, define the elements you want to analyze:
- In the Document view, select the group of atoms for which you wish to visualize the center-of-mass motion using the selection tools. To select multiple nodes, hold the Ctrl (or Cmd on macOS) key.
- If no atoms are selected, SAMSON will use the entire system. Similarly, if no paths are selected, all paths in the document will be included.

3. Create the Pathline Visual Model
To visualize the COM motion:
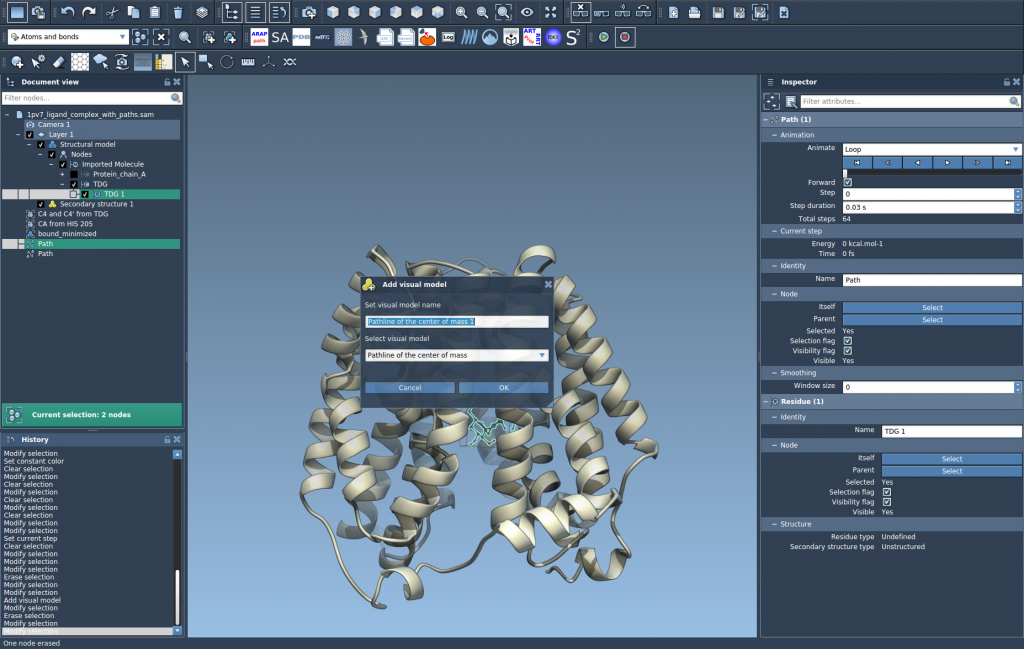
- Go to Visualization > Visual model > More…. Alternatively, use the shortcut Ctrl/Cmd + Shift + V.
- In the dialog box, select Pathline of the center of mass and click OK.
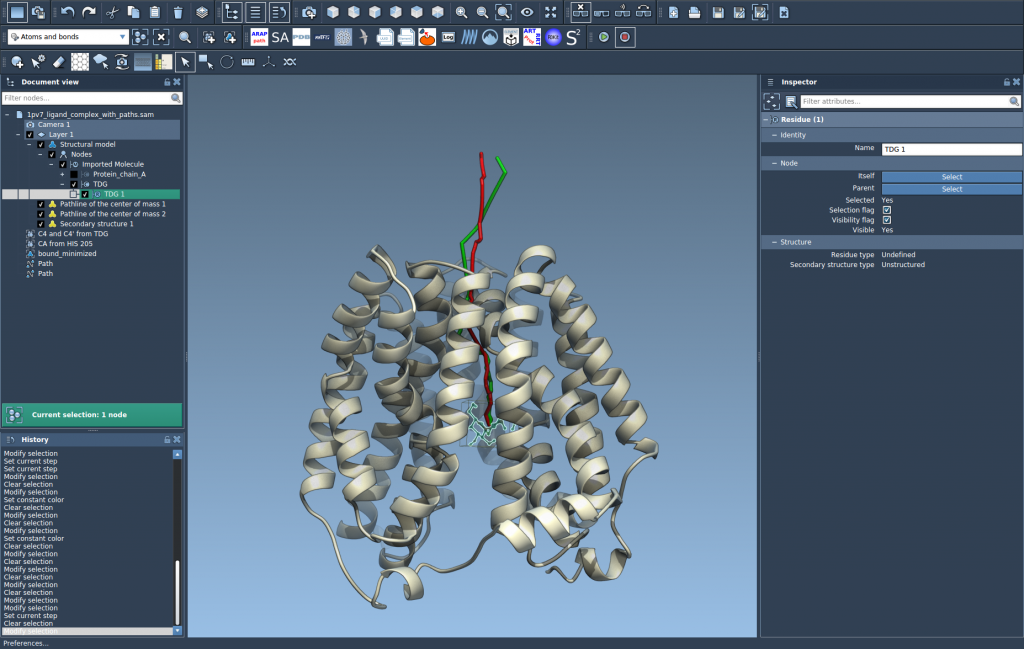
This will generate a visual pathline displaying the trajectory of the selected atoms along the chosen paths.
4. Customize and Explore
Once the pathline is created, you can customize and explore it further:
- Double-click a path in the Document view to play or pause the motion visualization.
- Access path-specific options by right-clicking on a path and navigating to Path > ….
- Adjust visual properties, such as color and thickness, in the Inspector by selecting the pathline visual model.
Why Pathlines Are a Must-Have for Molecular Modelers
SIMPLIFYING motion analysis not only saves time but also helps uncover patterns or anomalies that might otherwise go unnoticed. By providing an intuitive way to visualize the center-of-mass movement, Pathlines in SAMSON make complex simulations more accessible and actionable. If you’re dealing with ligand unbinding trajectories, collective domain motions in protein complexes, or reaction workflows, this tool can significantly improve your workflow.
To further explore Pathlines and their potential applications, visit the full documentation at https://documentation.samson-connect.net/tutorials/pathlines/pathlines/.
SAMSON and all SAMSON Extensions are free for non-commercial use. Get started today by downloading SAMSON at https://www.samson-connect.net.