



Molecular modelers often find themselves grappling with the challenge of processing simulation data to obtain accurate Potential of Mean Force (PMF) profiles. These profiles provide critical insights into molecular interactions, but generating them efficiently while ensuring reliability can be daunting. Fortunately, the GROMACS Wizard in SAMSON offers a straightforward method for PMF analysis using the Weighted Histogram Analysis Method (WHAM).
If you’re already familiar with umbrella sampling techniques, GROMACS Wizard makes it easy to take the next step and generate PMF profiles. Let’s explore how this works and why it’s so effective.
What Does PMF Analysis Help With?
By creating a PMF profile, you gain a better understanding of how energy varies as a function of a reaction coordinate. It’s a method for studying molecular interactions at a high level of detail, which can play a vital role in designing molecular systems or optimizing processes. However, ensuring that your reaction-coordinate space is thoroughly sampled is key to obtaining meaningful results.
Streamlined Workflow for PMF Analysis
One of the main advantages of GROMACS Wizard is its integration of WHAM for PMF computations. Following an umbrella-sampling simulation, here’s how you can proceed:
- Navigate to the WHAM Analysis tab within GROMACS Wizard.
- Choose the project path containing your umbrella sampling data. You can even use the auto-fill option (
 ) if you’ve just completed a relevant simulation.
 - Verify that the folder contains numbered subfolders for the same system and reaction-coordinate definition, ensuring data consistency.
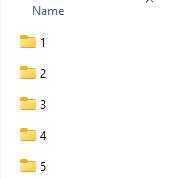
With this setup, GROMACS Wizard automatically loads critical details like reaction-coordinate information, temperature, and time range. It’s designed to eliminate the configuration overhead and accelerate your path to results.
Customizing and Computing the PMF
Once your project path is set, choose the reaction coordinate from the list and adjust optional parameters like custom bounds, time range, or energy units if they better suit your analysis. When ready, simply press Compute.
The tool generates two key plots:
- A PMF profile that provides the main insights into energy variation across the chosen coordinate.
- A histogram that visualizes how well the reaction-coordinate space is covered, helping identify regions that may need additional sampling.
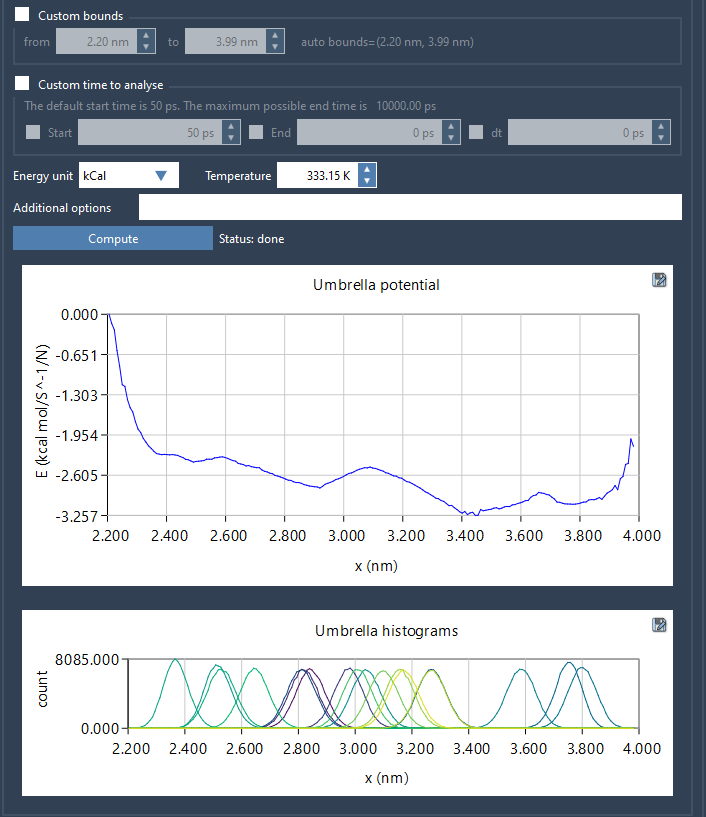
Depending on the size of your trajectories, computations might take a few seconds to minutes. Once completed, all profiles, histograms, and supporting plots are saved in your project folder under a wham_results subdirectory. Switching between reaction coordinates becomes seamless because previously computed data for the same parameters are reused.
Why Is Histogram Coverage Important?
The histogram reveals how uniformly the reaction-coordinate space has been sampled. Poor coverage in specific regions often means you need additional simulations or extended sampling for those sections. With GROMACS Wizard, identifying these gaps is simple, letting you refine your simulations and improve the reliability of your PMF data.
Where to Go Next
Once you’ve inspected the PMF profile and addressed any sampling gaps, consider moving forward with advanced analyses or revisiting umbrella sampling to improve specific aspects of your models. For detailed steps, visit the original documentation at this link.
*Note: SAMSON and all SAMSON Extensions are free for non-commercial use. You can get SAMSON here.