For researchers in molecular simulation, computing Potential of Mean Force (PMF) profiles can be an involved task—especially when dealing with data from multiple umbrella sampling simulations. Manual WHAM (Weighted Histogram Analysis Method) workflows in GROMACS often require scripting, data formatting, and cautious file organization. If you’ve ever wished this process could be visual and intuitive, the GROMACS Wizard in SAMSON might be what you’re looking for.
Let’s take a closer look at how GROMACS Wizard simplifies PMF analysis using WHAM, offering a dedicated graphical tab to configure settings, explore results, and ensure the consistency of your simulation data—all without the need to switch between terminals and text editors.
Why PMF, and what makes it tricky?
In molecular design and molecular dynamics, PMF curves are powerful tools. They help estimate free energy changes along reaction coordinates, making them a go-to analysis when studying processes like molecular binding or conformational changes.
However, PMF construction often involves numerous umbrella sampling windows, each with simulation outputs. Managing and assembling these into a coherent dataset is time-consuming and error-prone, especially when adjusting parameters like bounds or time intervals.
A Hands-On, Visual Approach
GROMACS Wizard’s PMF Analysis tab offers a clear solution. To begin:
- Navigate to the WHAM Analysis tab in the GROMACS Wizard inside SAMSON.
- Choose your project folder. If it was generated from the umbrella sampling step or batch computations, you can use the auto-fill button to quickly find it.

This folder should contain numbered subfolders for each window, each with reaction coordinate data. This standardizes your workflow and ensures compatibility with WHAM.

Once the data is loaded, you can:
- Select the reaction coordinate of interest
- Optionally adjust bounds, simulation time, or units
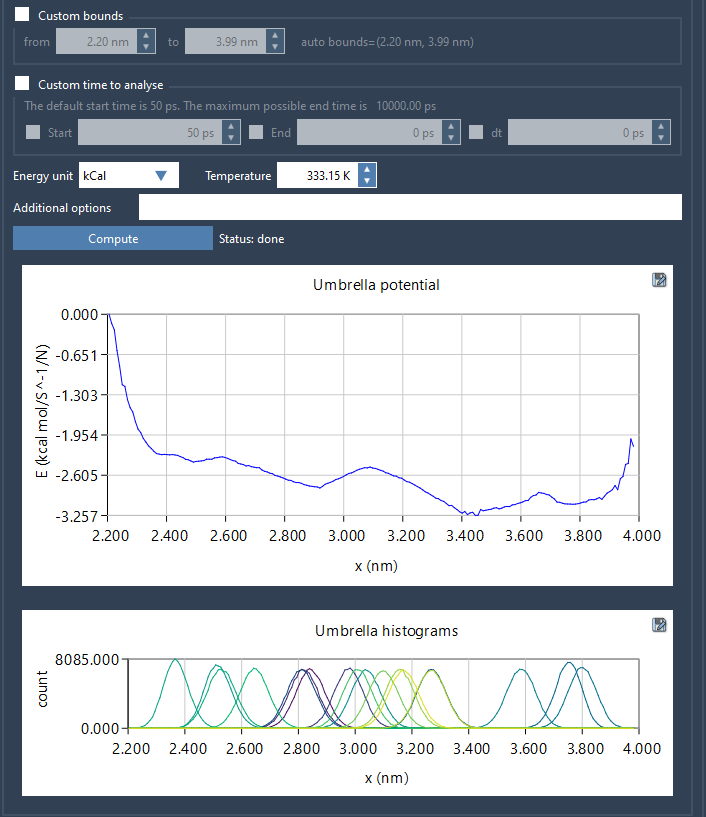
- Click Compute to run WHAM
The wizard then generates PMF curves and histogram plots directly inside the interface. These visuals help you quickly assess the convergence of your simulations and identify areas where sampling may be insufficient.

Data Reusability
What’s helpful is that all results are saved inside a dedicated wham_results folder. So, if you want to switch between reaction coordinates or tweak parameters later, you won’t have to recompute everything from scratch. This promotes efficient exploration without redundancy.
Conclusion
With GROMACS Wizard’s PMF Analysis tools, molecular modelers can streamline one of the more time-consuming aspects of free energy calculations. The visual interface, automatic project recognition, and built-in plotting make this part of the workflow more accessible and less error-prone.
To learn more and explore this feature in detail, visit the official documentation.
SAMSON and all SAMSON Extensions are free for non-commercial use. You can get SAMSON here.


