


Molecular dynamics simulations are invaluable for understanding how molecules behave over time, whether studying protein folding, drug interactions, or chemical reactions. But analyzing these simulations can be a daunting task. One recurring challenge for molecular modelers is quickly pinpointing regions of high activity or areas of unusual stability along a molecular path. This is where SAMSON’s Average Velocity analysis becomes a helpful tool.
What Is Average Velocity Analysis?
The Average Velocity feature in SAMSON’s Path Analyzer enables users to compute the mean velocity magnitude of a selected group of atoms along a molecular path. By focusing on average velocities, it becomes easier to spot bursts of motion (regions where the dynamics accelerate) or identify particularly quiet moments of stability in your simulation.
This type of insight is not only helpful for understanding molecular behavior in dynamical trajectories but also for identifying key areas for further investigation. For example, motion bursts can correspond to conformational changes, while quiet regions may indicate structural stability. Both can inform decision-making in molecular design workflows.
How to Add an Average Velocity Plot
Adding this analysis to your simulations is straightforward in SAMSON:
- Open the Path Analyzer extension in SAMSON.
- Select Average velocity from the options under Observable.
- Choose a Path you want to analyze.
- Define the Group of atoms to include in the analysis.
- Use the Add Velocity Series or Add Velocity Distribution button to visualize the data.
Exploring the Outputs
The tool offers two distinct views for analyzing the data:
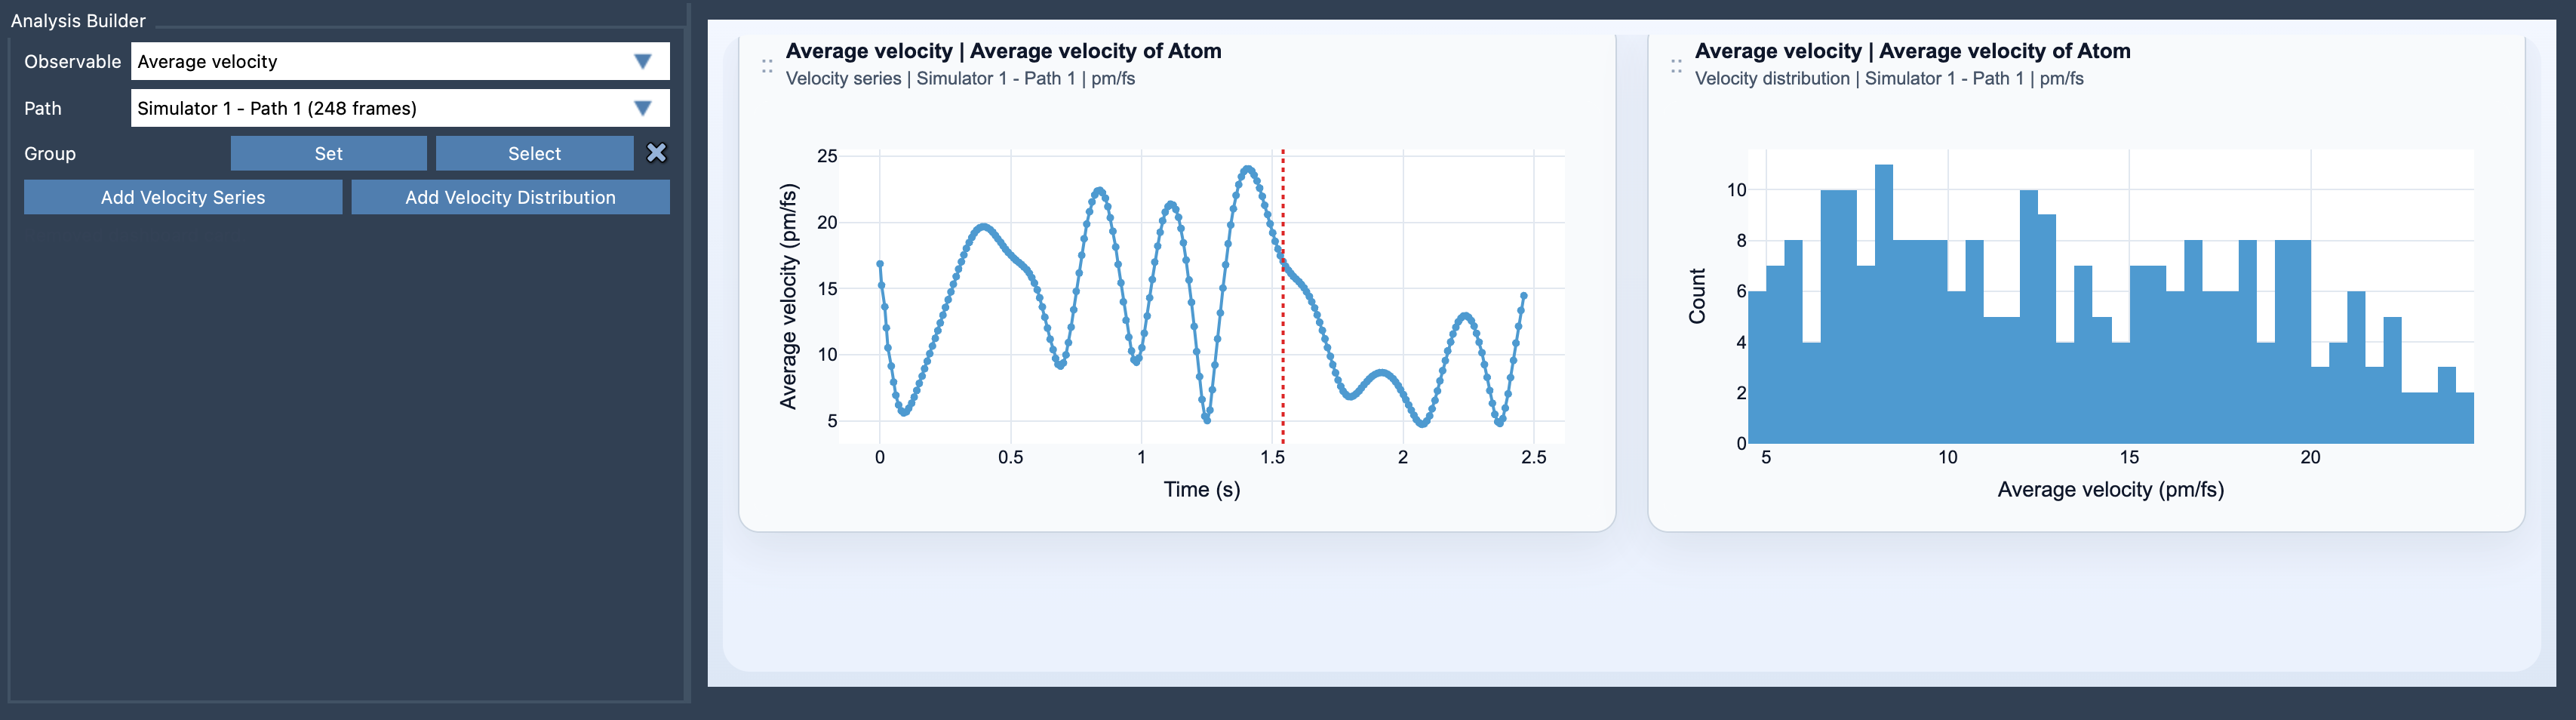
- Velocity Series: This view plots the mean velocity magnitude along the path, frame by frame, providing a clear visual representation of how motion varies over time.
- Velocity Distribution: This view shows a statistical distribution of the velocities, helping to quantify how motions are distributed throughout the path.
Here’s an example visualization from SAMSON:
Tailoring Your Analysis
SAMSON makes this feature even more versatile by allowing users to switch between different units, such as pm/fs, A/ps, and m/s, depending on the scale of your system. You can adjust these units even after creating your plots, which ensures flexibility regardless of the system you’re analyzing.
Tips for Applying Average Velocity
Here are some practical tips to get the most out of this feature:
- Focus on simulations that include meaningful dynamical information — systems with varying kinetic activity stand to benefit the most from average velocity analysis.
- Comparing average velocity data with Average Force plots can reveal how forces drive molecular motion, making it easier to connect causes and effects.
Conclusion
The Average Velocity analysis in SAMSON offers a practical way to extract valuable insights from molecular dynamics simulations. Whether you’re investigating bursts of activity or quiet regions of motion, this feature gives you the tools you need to make sense of your data more efficiently.
To learn more, visit the official documentation page.
Note: SAMSON and all SAMSON Extensions are free for non-commercial use. You can get SAMSON here.