


Understanding protein backbone conformations is essential for molecular modelers aiming to study secondary structures, conformational preferences, or identify anomalies. The Ramachandran plot is a tried-and-tested tool for this task, but integrating it effectively into your analysis pipeline can sometimes be challenging. Let’s explore how SAMSON makes this easier with its Ramachandran plotting feature, enabling you to gain valuable insights from protein conformations.
What is the Ramachandran plot?
The Ramachandran plot is a visualization tool for exploring backbone conformations of proteins by charting φ (phi) and ψ (psi) angles in a 2D space. By plotting these angles, researchers can observe:
- Secondary-structure preferences: Identify regions corresponding to α-helices, β-sheets, or other structural motifs.
- Conformational outliers: Detect residues that might behave unusually under given conditions.
- Transition mapping: Track backbone conformational changes along a molecular dynamics path.
SAMSON’s ability to generate these plots seamlessly adds significant value when studying proteins, whether for folding, stability analysis, or drug discovery purposes.
Adding the Ramachandran plot in SAMSON
SAMSON provides an intuitive step-by-step process to incorporate Ramachandran plots into your workflows:
- Open the Path Analyzer within SAMSON.
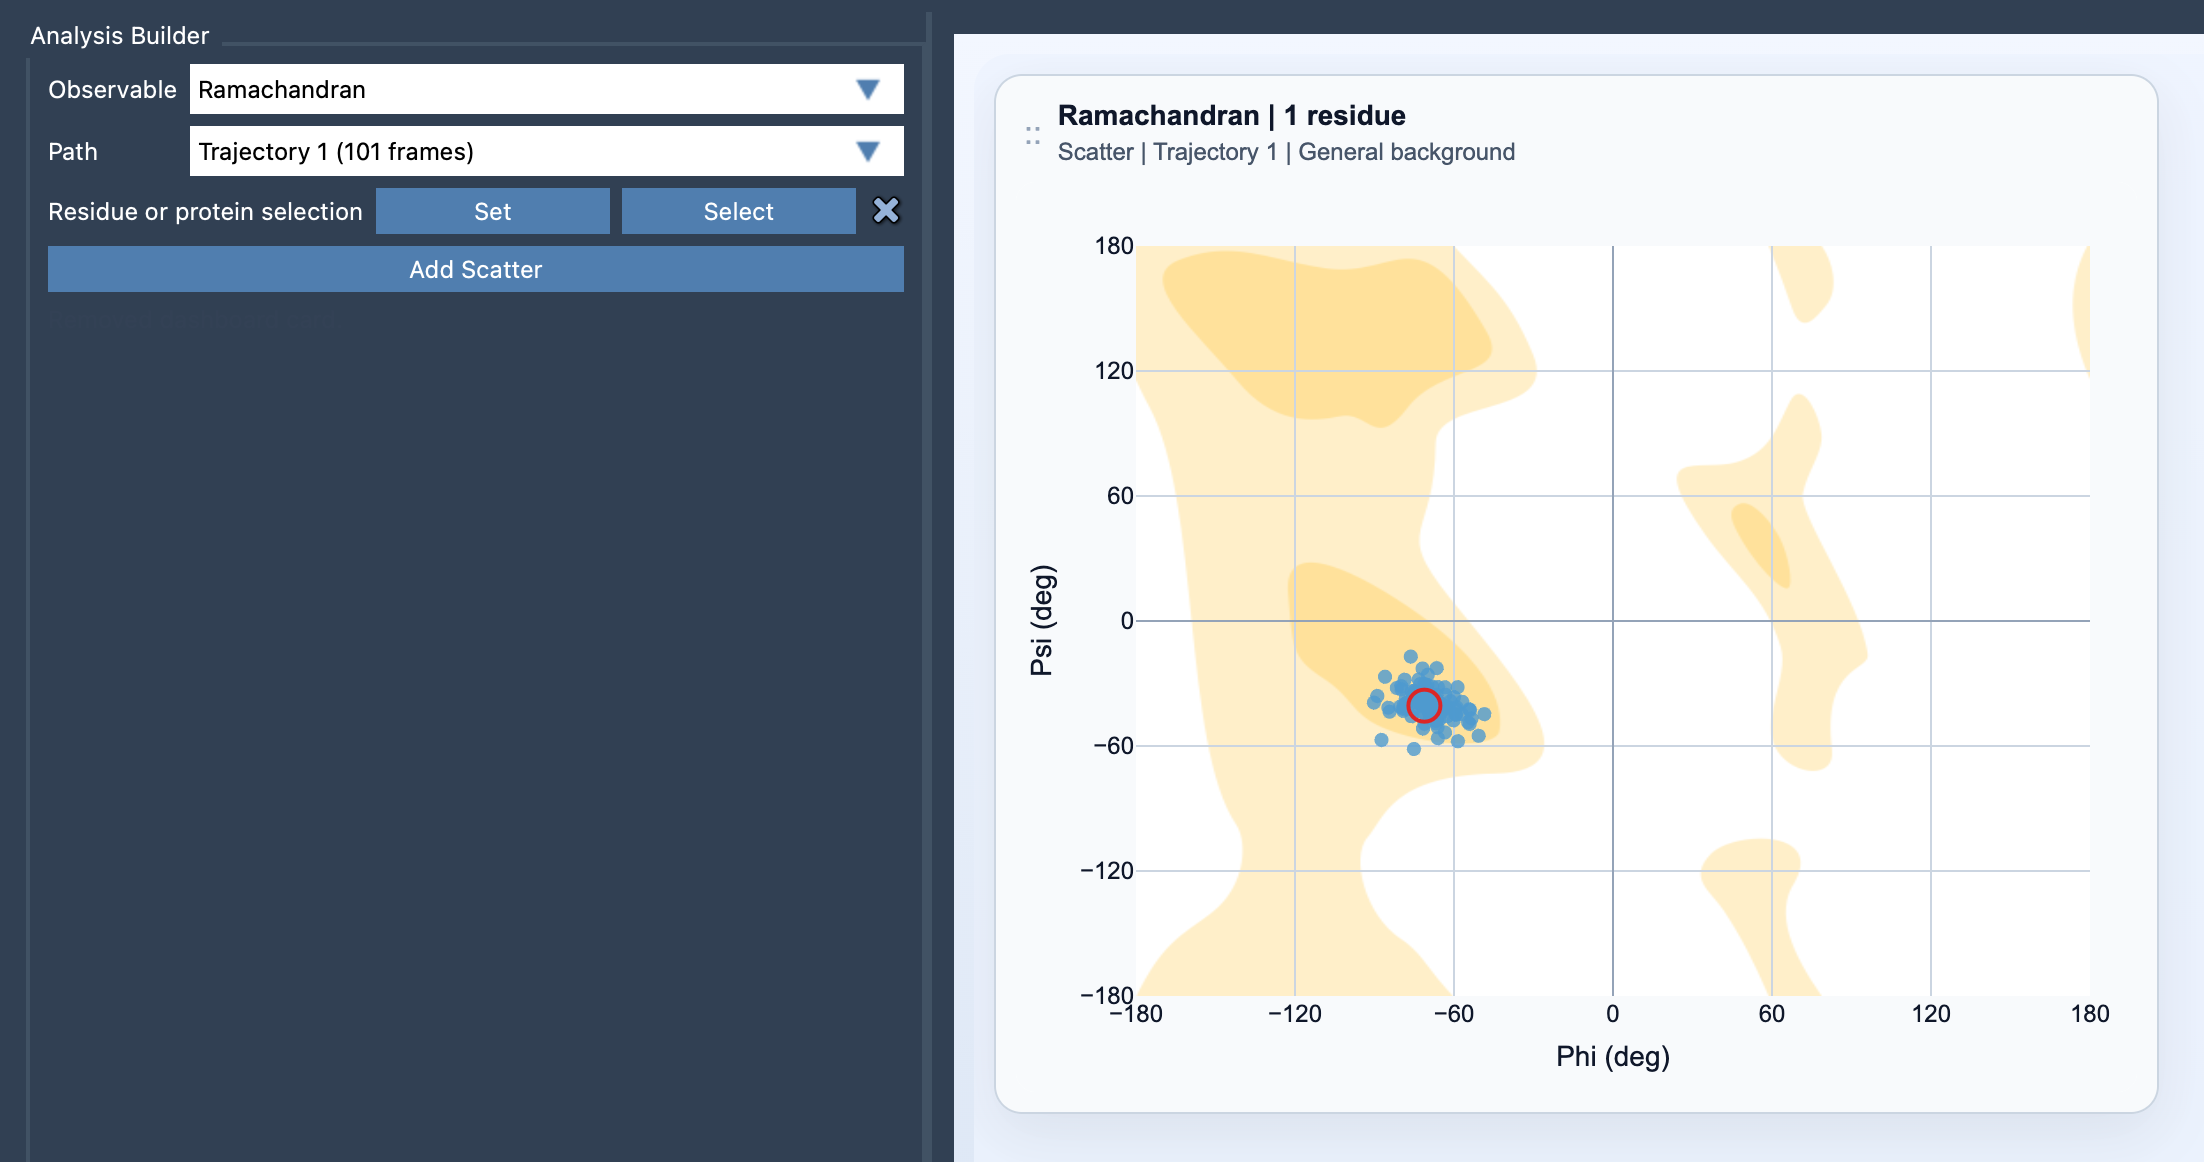
- Select Ramachandran under Observable, ensuring that the desired protein or residue selection is loaded.
- Define your Path, which represents the molecular trajectory you aim to analyze.
- Specify your residue or protein selection to focus the plot on areas of interest, for example, loops or binding sites.
- Click Add Scatter – and the Ramachandran plot will be generated based on your defined parameters.
Powerful interactions for deeper insights
What sets SAMSON’s Ramachandran plotting apart is its interactivity. You don’t just visualize data but extract actionable insights effortlessly:
- Click: Select a point on the plot to move to the corresponding frame in the molecular dynamics simulation.
- Double-click: Identify the exact residue responsible for the point, enabling targeted investigations.
Customizing your approach
Depending on your research focus, SAMSON supports different types of protein selections:
- For detailed studies, such as investigating specific active sites or loops, use a focused residue selection.
- For a broader perspective on the entire protein’s behavior, choose a global protein selection.
And that’s not all: if you’re already employing secondary structure or RMSD analysis, Ramachandran points can act as a complementary resource to contextualize conformational sampling further.
Focusing on user convenience
SAMSON’s Path Analyzer module takes care of predefined settings, like choosing a suitable background for the plot. However, users can adjust these settings in card options later for a fully tailored experience. Such flexibility ensures that modelers of all levels—beginner or experienced—can work comfortably within their specific research requirements.
Ready to dive deeper? Visit the complete documentation for Ramachandran plotting in SAMSON here and supercharge your protein analysis.
Note: SAMSON and all SAMSON Extensions are free for non-commercial use. You can download SAMSON at https://www.samson-connect.net.