



Molecular modelers often face the challenge of deriving the Potential of Mean Force (PMF) profile from their umbrella sampling data. Ensuring consistent organization of simulation data, selecting proper reaction coordinates, and computing reliable PMF profiles can feel daunting. If you’ve been in this situation, GROMACS Wizard in SAMSON offers an integrative solution for performing PMF analysis through its Weighted Histogram Analysis Method (WHAM) feature.
Why Perform PMF Analysis?
PMF analysis is fundamental in understanding free-energy profiles along reaction coordinates, which are critical for characterizing molecular interactions and transitions. This information provides valuable insights into system properties that are not directly evident from raw simulation data.
How GROMACS Wizard Simplifies the Process
GROMACS Wizard streamlines PMF computation by guiding you through a logical process, ensuring an efficient workflow. Below, we summarize the steps to compute your PMF while avoiding common roadblocks:
Step 1: Start with Organized Data
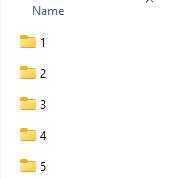
Ensure that your umbrella sampling workflow is complete. GROMACS Wizard expects your input folder to contain numbered subfolders, each representing a simulation window for the same system and reaction-coordinate setup. If your data structure meets these criteria, moving forward will be smooth!
Step 2: Leverage WHAM Analysis
Navigate to the WHAM Analysis tab in GROMACS Wizard. After selecting the project path, you can choose a reaction coordinate from the automatically loaded options. Additionally, you might adjust optional settings like bounds and time ranges depending on your simulation requirements.
 Tip: Use the auto-fill feature to quickly link the data from your last umbrella sampling simulation.
Step 3: Analyze the Output
Once computed, GROMACS Wizard generates two key visualizations:
- The PMF profile, showcasing the free-energy curve along the reaction coordinate.
- A histogram demonstrating how well the reaction-coordinate space has been sampled.
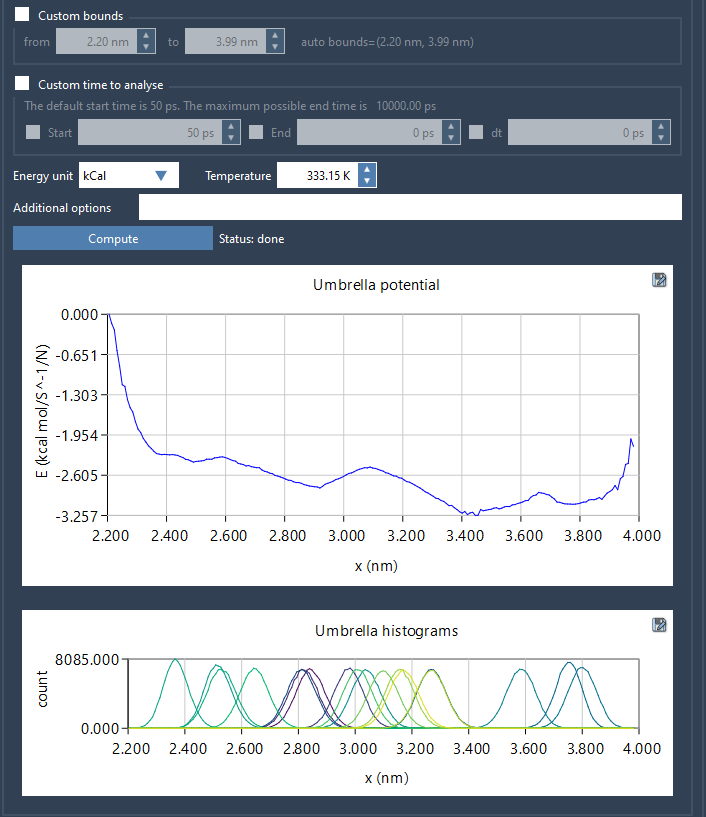
These plots provide critical insights into your data. For example, the histogram can help identify any sampling gaps in the reaction-coordinate space, signaling areas where additional simulations might be required.
Why Efficient PMF Analysis Matters
Inadequate sampling or inefficient workflows can lead to incomplete or unreliable PMF profiles, which can misrepresent molecular behavior. By automating tasks like folder structure validation and reaction coordinate selection, GROMACS Wizard reduces the likelihood of human error. Additionally, its WHAM capabilities ensure robust computations, saving time and enhancing reproducibility.
Next Steps
After inspecting the PMF profile and ensuring adequate sampling coverage, you might find it necessary to revisit the umbrella sampling stage and extend or add simulations for certain windows. GROMACS Wizard helps you align each step of the process, ensuring you’re always equipped to improve your results.
To learn more, visit the full documentation page on PMF Analysis in GROMACS Wizard.
SAMSON and all SAMSON Extensions are free for non-commercial use. You can download SAMSON here.