



As a molecular modeler, efficiently converting umbrella sampling data into a clear Potential of Mean Force (PMF) profile can sometimes feel like a challenging task. If you’ve ever struggled with aligning varying simulation data or ensuring accurate representation of your system’s reaction-coordinate space, this post is for you. Today, we’ll delve into streamlining PMF analysis using the GROMACS Wizard in the SAMSON platform. Whether you’re tackling large trajectories or optimizing your workflow, this guide aims to make the process easier and more effective.
What is PMF and Why Is It Useful?
The Potential of Mean Force (PMF) offers insight into the energetics of a system along a reaction coordinate, often used to determine free energy profiles in molecular simulations. This can be critical for studying interactions, stability, and mechanisms in molecular systems. However, obtaining accurate PMF profiles requires an intermediate step using Weighted Histogram Analysis Method (WHAM), which can often be cumbersome without the right tools. With GROMACS Wizard, this workflow becomes significantly more user-friendly.
How to Compute the PMF Profile
To begin your PMF analysis, ensure you have completed an umbrella sampling workflow, and that your input folder is correctly organized. This means your folder should contain subprojects corresponding to the same system and reaction-coordinate setup. Once this is ready, follow these steps:
- Navigate to the WHAM Analysis tab in the GROMACS Wizard.
- Select the project path. For convenience, click auto-fill (
 ) to quickly populate this field based on your last umbrella sampling step.
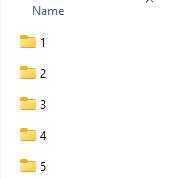
 - Confirm that your project contains numbered subfolders aligned with your reaction-coordinate setup, as shown below:
- Pick the reaction coordinate of your choice from the dropdown list that appears.
- Fine-tune optional settings if needed, such as custom bounds, custom time ranges, or energy-unit preferences.
Finally, hit Compute. Depending on the size of your trajectory, the computation might take a few seconds to several minutes. GROMACS Wizard will automatically handle technical components like loading the reaction-coordinate data, time range, and temperature settings from your project.
Visualizing the Results
Once the computation finishes, GROMACS Wizard produces two key visual outputs:
- The PMF profile, which gives a direct representation of the free energy landscape along the reaction coordinate.
- A histogram illustrating how evenly the reaction-coordinate space was sampled, helping identify areas where additional sampling may be necessary.
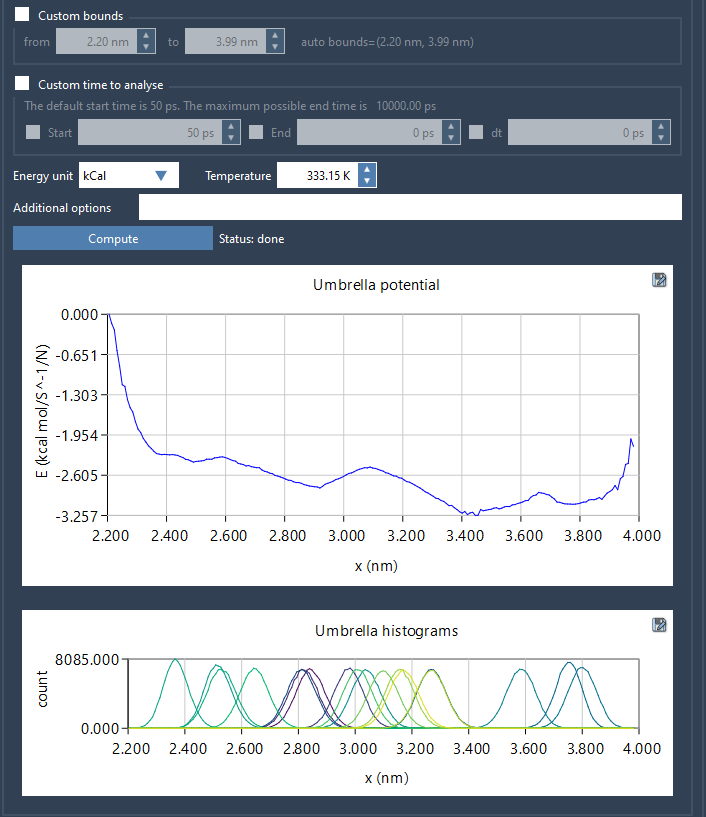
The histogram plays a crucial role in evaluating how comprehensive your sampling was. A poorly covered reaction-coordinate space might indicate the need for further umbrella sampling simulations in specific regions. All resulting profiles, histograms, and plots will be saved in your project’s wham_results folder for easy reuse.
Next Steps in Your PMF Workflow
After analyzing your PMF profile and histogram, determine whether you need additional sampling for regions with insufficient coverage. If needed, return to the Umbrella Sampling step to refine or extend your simulations. This iterative refinement ensures you get the most accurate representation of your system’s free energy landscape.
To dive deeper into this workflow, visit the original guide here.
SAMSON and all SAMSON Extensions are free for non-commercial use. Get SAMSON today at https://www.samson-connect.net.